Project List
01219116 Programming II
Second Semester, 2023. Section 450
Car Model Analysis
Car Model Analysis which analyzes car models for customers in car showroom and motor show. This program will provide the users with insight into private fuel cars to compare the capabilities. Users can create graphs in this program to find out the distribution of each attribute for each car model.
Main features
- Has a default graph when the program starts.
- Allow users to select categories before submitting.
- After submitting categories, display graphs according to selections.
- To submit categories and display graphs or statistics, press one of seven buttons at the bottom of the menu bar.
- Contain a page for storytelling.
Design patterns
- Facade design pattern
- Singleton design pattern
- MVC design pattern
Installation
Run these commands respectively
1. Clone github repository
- git clone https://github.com/Thanawas-Sirilertsathit/Car-Model-Analysis.git
2. Change directory to Car-Model-Analysis
- cd Car-Model-Analysis
3. Look for preview tag
- git checkout final
4. Create new virtual environment
- python -m venv env
5. Activate virtual environment
- env\Scripts\activate (For window)
- source env/bin/activate (For mac and linux)
6. Install required modules
- pip install -r requirements.txt
7. Run car_main file
- python car_main.py
Data reference
- https://www.kaggle.com/datasets/goyalshalini93/car-data
Documents
Project Description
This project involves a comprehensive analysis of Spotify's top tracks from 2023. It includes examining a varied dataset containing song specifics, artist details, and streaming metrics across various platforms.
Install and Run
- Clone this repository to your local machine follow by your desired directory name.
git clone https://github.com/oaoak/Spotify-Hot-Hits.git your_directory_name
- Change your directory if you are not on it.
cd your_directory_name
- Create virtual environment.
python -m venv env
- Change to your newly created virtual environment.
. env/bin/activate
- Install packages from requirements.txt
pip install -r requirements.txt
- Run the main block.
python main.py
Heart-Attack-Analysis: GoodHeart Project
Description
The "GoodHeart" project is an interactive Python GUI application built using Tkinter. It is designed to visualize, analyze, and gain insights from heart disease data. The project adheres to object-oriented design principles and provides user interaction capabilities to explore the data effectively.
Application UI
Key Features
- Users can explore descriptive statistics of the dataset.
- Users have the flexibility to select their preferred graph type, range, and attribute for plotting.
- Users can investigate relationships between different attributes and generate custom visualizations to uncover hidden patterns and trends.
Running the Application
- Clone the project:
git clone https://github.com/colarrbear/Heart-Attack-Analysis.git - Navigate to the Heart-Attack-Analysis directory:
cd Heart-Attack-Analysis - Create a virtual environment:
python3 -m venv env - Activate the virtual environment:
source env/bin/activate - Install requirements:
pip install -r requirements.txt - Navigate to the code directory:
cd code - Run the application:
python3 main.py
SteamLens
SteamLens is a GUI data processing and visualization for steam games.
Description
SteamLens utilizes a dataset comprising Steam game data for processing and visualization, encompassing information such as game name, release date, price, supported operating systems (Windows, Mac, Linux), user scores, positive and negative votes, developers, publishers, categories, genres, and tags.
SteamLens UI
Home menu

Search menu

Game price distribution menu

Game relationship menu

Game released each year menu

Game insights dashboard menu

Requirements
- python >= 3.9
- Git LFS
SteamLens Data
SteamLens Related Sites
RBX (Roblox) Class Name Prediction
An application for Programming II Course course at Kasetsart University.
This application is for predicting class name of a datamodel tree where the name is known but the classname isn't, written in Python.
This is useful for applications where finding the class name is difficult or requires a lot of time and where precision isn't very important such as displaying the preview of the datamodel tree before getting the actual class name to display later.
Requirements
Requires Python 3.11.4. Required Python packages are listed in requirements.txt.
Running the Application
- Clone the repo
$ git clone https://github.com/Pawat-Sarnchawanakit/year-project.git year-project - Cd into the directory
$ cd year-project - Create a virtualenv:
$ python -m venv .venv - Activate the virtualenv and run
$ pip install -r requirements.txt - Run the application:
$ python main.py
Tutorial / Demo
Github
ShopperTrends-Analyzer
Description
ShopperTrends-Analyzer is a data analysis and visualization tool designed to provide valuable insights into customer shopping preferences and behavior. With a comprehensive dataset encompassing various customer attributes such as age, gender, purchase history, preferred payment methods, and feedback ratings, ShopperTrends-Analyzer enables businesses to understand their customer base better and make informed decisions to enhance their products and services.
Features
- Data Visualization: Explore customer data through interactive visualizations such as bar charts, pie charts, line charts, scatter plots, histograms, and box plots.
- Filter Options: Easily filter the data based on categories, sizes, locations, and seasons to focus on specific segments of interest.
- Top Items Analysis: Identify the top-selling items and gain insights into popular colors, sizes, subscription rates, and discount application for each item.
- Attribute Explorer: Investigate relationships between different attributes and generate custom visualizations to uncover hidden patterns and trends.
- Descriptive Statistics: Access descriptive statistics for various attributes, providing a comprehensive overview of the dataset.
Design Pattern
ShopperTrends-Analyzer uses the MVC (Model-View-Controller) design pattern, separating the application logic, data, and presentation layers. This architectural approach promotes modularity, scalability, and maintainability.
Documents
Github Link
Data Source
Credit to Sourav Banerjee, Customer Shopping Trends Dataset
Popular Spotify Songs
Summary
This project aims to create a standalone GUI application using Python and Tkinter to visualize and analyze Popular Spotify Songs data. It provides descriptive statistics, correlations, and interactive visualizations to gain insights into music trends.
Features
- Interactive GUI allowing users to explore Spotify song data.
- Visualization of distribution graphs, pie charts, and bar graphs for insights into song release years, danceability percentage, and other trends.
- Descriptive statistics and correlation analysis using scatter graphs for features such as danceability percentage and BPM (beats per minute), providing insights into the rhythm and tempo of songs.
GitHub Repository
Wine Quality
Description
A data-driven application that provides insights into the quality and characteristics of wines based on physicochemical attributes. Leveraging a comprehensive dataset from Cortez et al., 2009, Wine Explorer allows users to explore descriptive statistics, correlations, and visualizations of wine data to gain a deeper understanding of wine characteristics and quality determinants.
Installation
- Clone the repository:
git clone https://github.com/Unikorn996/wine-analysis.git
- Change the directory:
cd your_directory
- Install the required packages:
pip install -r requirements.txt
- Run the application:
python app.py
Analyzing Vehicle Distribution in Bangkok’s Transportation Networks
Overview
This program, named "Analyzing Vehicle Distribution in Bangkok’s Transportation Networks", provides visualizations based on publicly available data regarding traffic volume across roads and crossroads in Bangkok. Users can choose from various visualization types such as graphs, distributions, and time series. Additionally, the program displays statistics including centrality and variability of the data. Users can create multiple tabs and switch between them to view different visualizations.
References
Academic Performance Management Program
About the project
This repository is a tkinter-based project aimed to facilitate the management of student scores, offering features such as adding or removing students, grouping them based on test scores, generating basic graphs, and displaying fundamental statistics for individual or multiple students.
Features
- Add or remove students from the list
- Group students based on test scores (students with similar scores stay together, or arrange the scores of all groups to be as similar as possible)
- Generate basic graphs for selected students (bar charts, histograms, scatter plots, box plots)
- Display fundamental statistics for individual or multiple students (min, max, average, standard deviation, median)
- Data storytelling page to visualize student performance and grade distribution
Design Pattern
Controller
Screenshots


Project Documents
seqence diagram


Data Sources
- Student's Scores - Kaggle dataset used in the application.
GitHub repository
VALORANT is a free-to-play first-person 5v5 character-based tactical FPS tactical hero shooter developed and published by Riot Games. This project is a comprehensive tool for analyzing VALORANT player performance in the VALORANT Champions Tour 2023 (VCT2023). It allows users to analyze player statistics and match performance to gain a deeper understanding of the player's strengths, weaknesses, and contributions to their team's success.
Link to Wiki
Design Documents and UML Diagrams
Data Sources
Python Version
Requires Python >= 3.10
Main Features
- Player Statistics: Details of player statistics, such as in-game name, unique agents used, agent types, rating, average combat score, kill/death ratio, kills per round, average damage dealt per round, etc.
- Comparison Tools: Allows users to compare players’ performance (bar chart, pie chart, scatter plot, histogram, and box plot).
How to run the application
- Clone the repository git clone https://github.com/nicharr-nn/ValorantVCT2023.git
- cd into the project directory cd ValorantVCT2023
- Create a virtual environment by running the following command in the terminal: python -m venv venv
- Activate the virtual environment by running the following command in the terminal: MacOS or Linux: source venv/bin/activate Windows: venv\Scripts\activate
- Install the required packages by running the following command in the terminal: pip install -r requirements.txt
- Run the application by executing the following command: python main.py
Video
Description
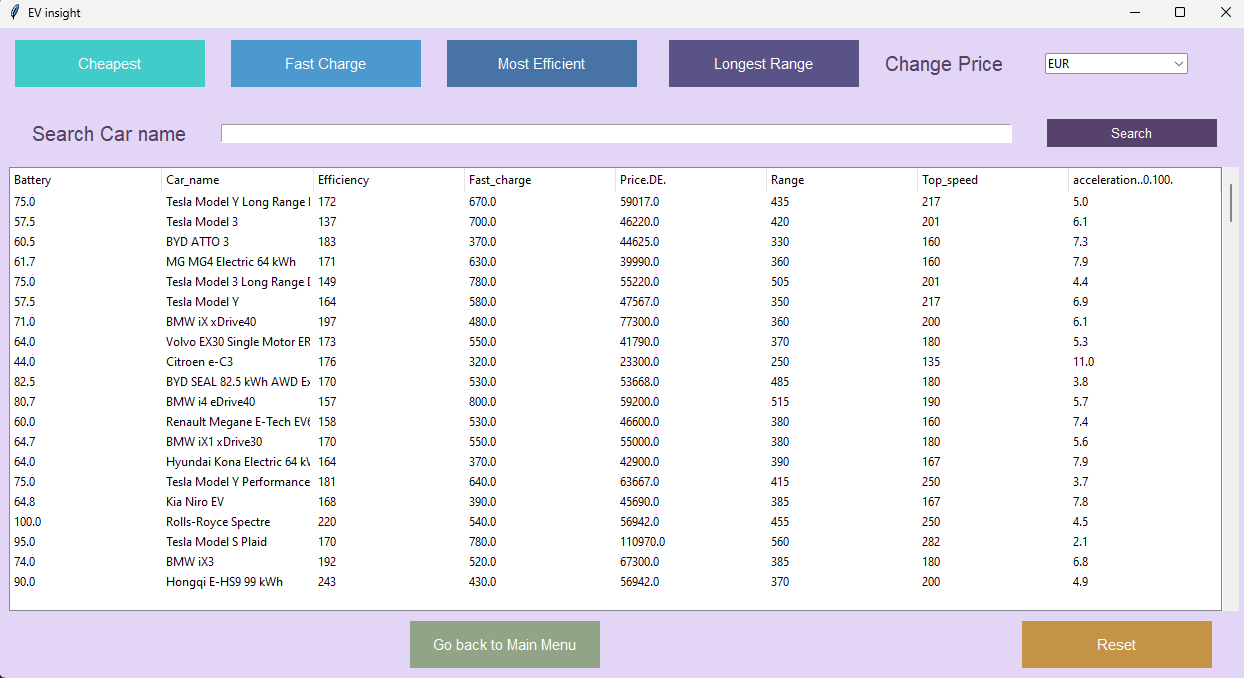
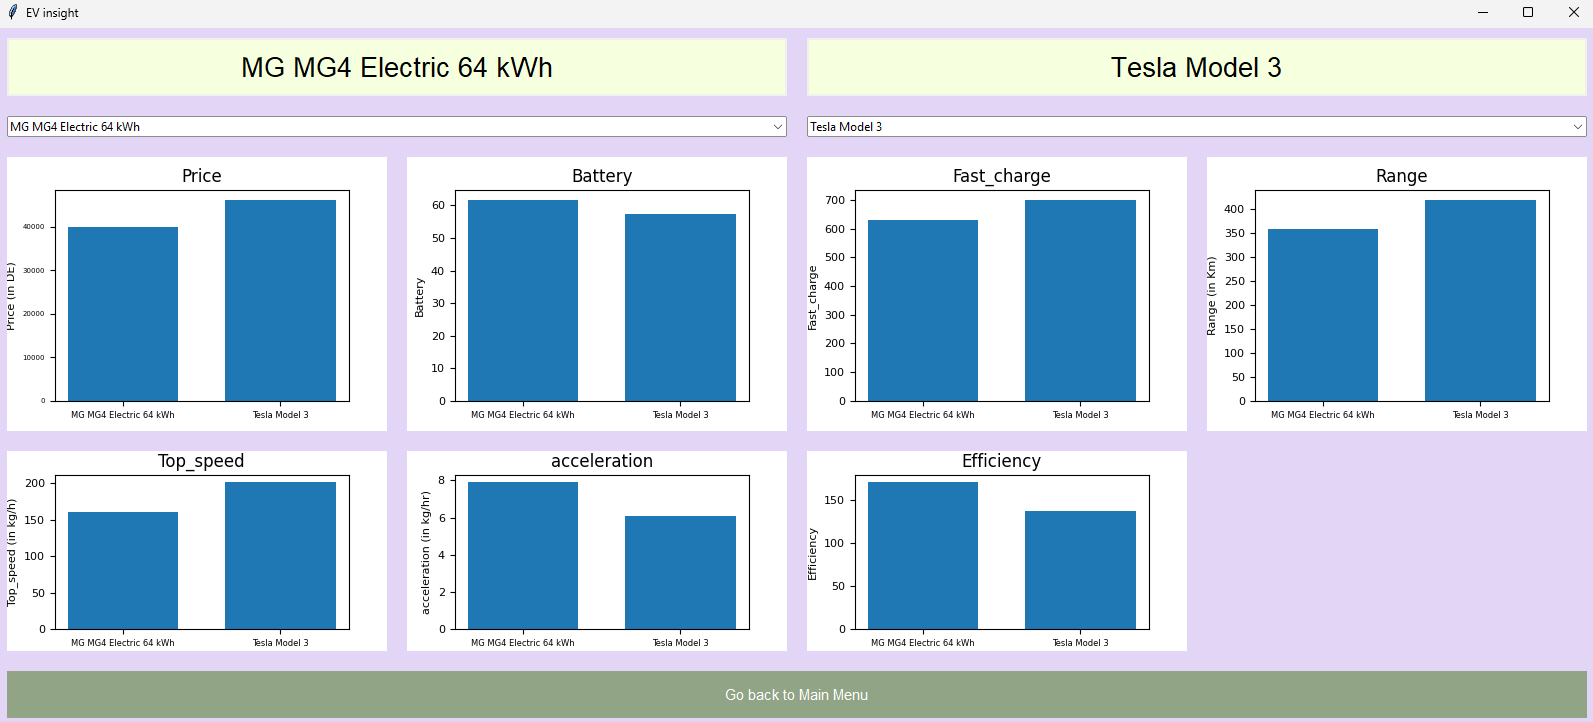
EV-Insight is a program that allows users to find information of different EV car and can also compare attribute of 2 cars to help users choose the best EV cars for them.
Data Sources
200k+ homes for sale in Thailand dataset from https://www.kaggle.com/datasets/fatihilhan/electric-vehicle-specifications-and-prices/data. This dataset encompasses a rich array of information crucial for understanding the landscape of electric mobility. Each entry includes details on the vehicle's battery capacity, model name, link to the EV Database for additional information, efficiency ratings, fast-charging capabilities, pricing in Germany, range, top speed, and acceleration from 0 to 100 km/h.
Installation
- Clone GitHub repository - git clone https://github.com/Pong50887/EV-Insight.git
- Create new virtual environment - python -m venv env
- Activate virtual environment - . env/bin/activate
- Install required modules - pip install -r requirements.txt
- Run main file - python main.py
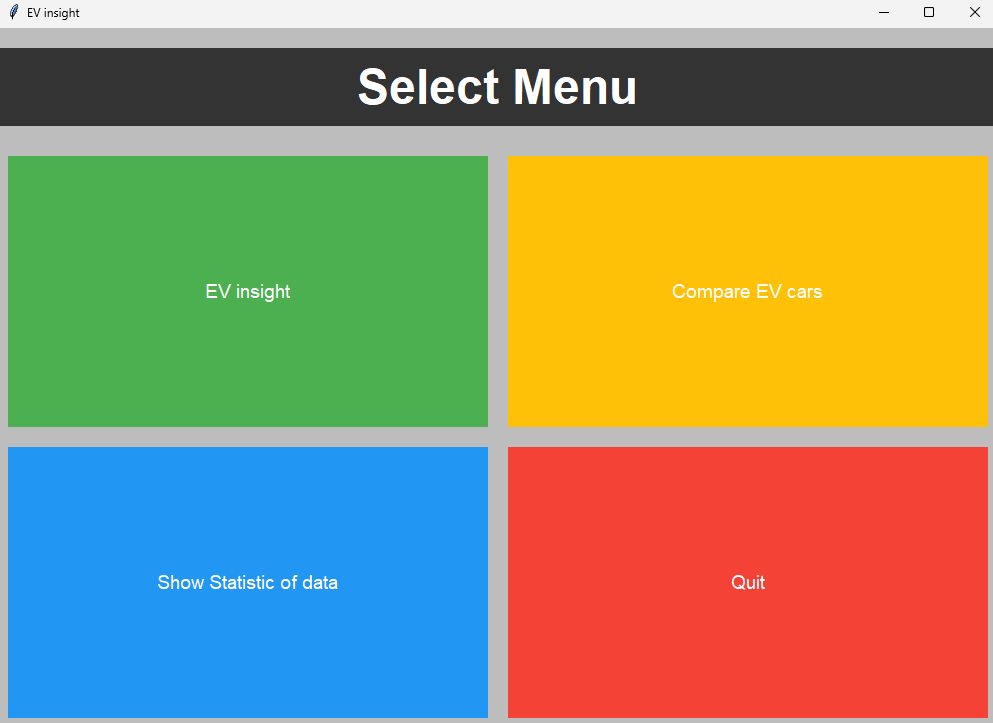
Main Menu
Insight Menu
Compare Menu
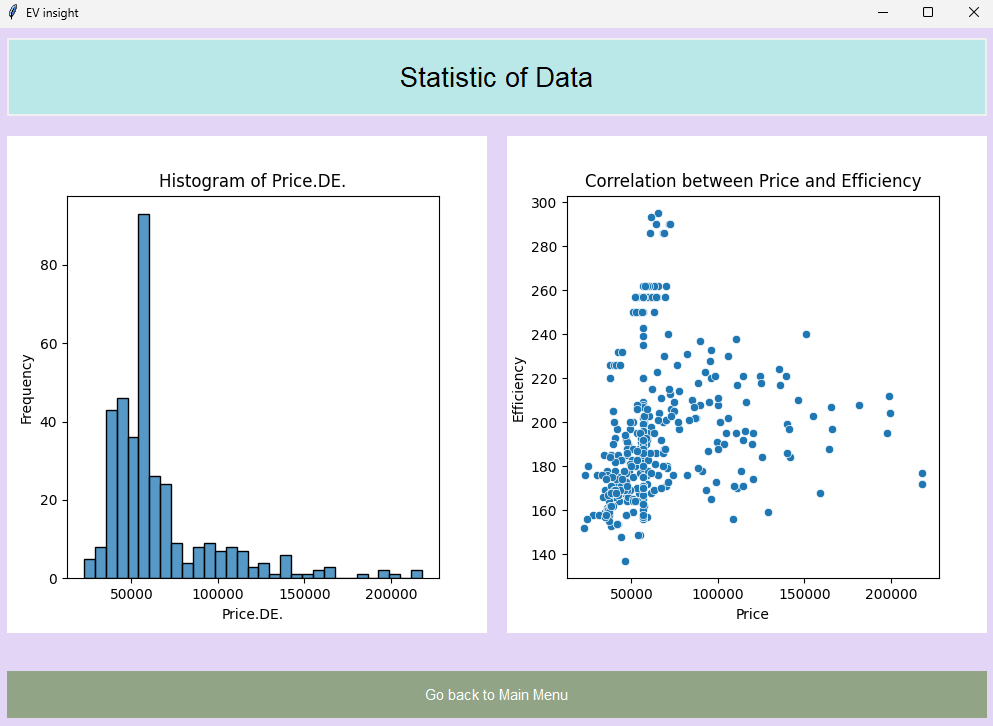
Statistic Menu
Code Structure
- main.py : run program
- GUI.py : contain all of GUI
- conversion_rate.py : contain data class of conversion rate
- graph_plot.py : contain class graph plot
- read_data.py : contain class Data
- search_data.py : contain class process and calculation.
GitHub
Project Proposal, Development plan
UML and Sequence Diagram
Description
The Bus Service Planner is a graphical user interface application designed to assist users in planning bus routes. Users can input their desired starting and ending bus stops, and the application will provide route information. The project aims to develop a Shuttle Bus Service Route Planner for Kasetsart University, facilitating efficient navigation and finding a shortest route for students and staff.
Main Features
- Compute the shortest route
- Show the shortest route on display
- Get user input by selecting the route, starting point and destination
- Show the distance between two points.
To install the Bus Service Planner, follow these steps:
1.Clone the repository to your local machine. git clone https://github.com/Phantawat/Bus-Service-Planner 2.Install the required dependencies using pip: pip freeze > requirements.txt pip install -r requirements.txt 3.Prepare the necessary data by downloading the bus data from [Bus_Service_Planner.csv].
How to Run
To run the Bus Service Planner, follow these steps:
Navigate to the project directory in your terminal. Run the main Python script: python bus_service_app.py The Bus Service Planner GUI will launch.
Github repository https://github.com/Phantawat/Bus-Service-Planner
The Game Rating Predictor A Star Seeker's Guide
This project is my year 1 final project for the Programming II course at Kasetsart University.
The reason why I made this project is I want to make a program that is a platform for Game Developers to discuss and share their ideas to make their game better and achieve higher score ratings from players.
Main Features
-
See the statistics of each game
-
The user can see the relationship between each factor that affects the Rating score.
-
The user can create a graph to see the relationship between other factors.
-
-
See the data of 20000++ games
- The user can select the game's title to see the data of that game. For example, Rating Score, Total Players, Summary of the game.
-
Talk with each other
- The users can create a forum to ask or give their ideas to other game developers.
Design patterns
MVC design pattern
Requirements
Requires Python 3.11 and Python Packages that are listed in requirements.txt.
Database
My database comes from Popular Video Games 🎮🕹️
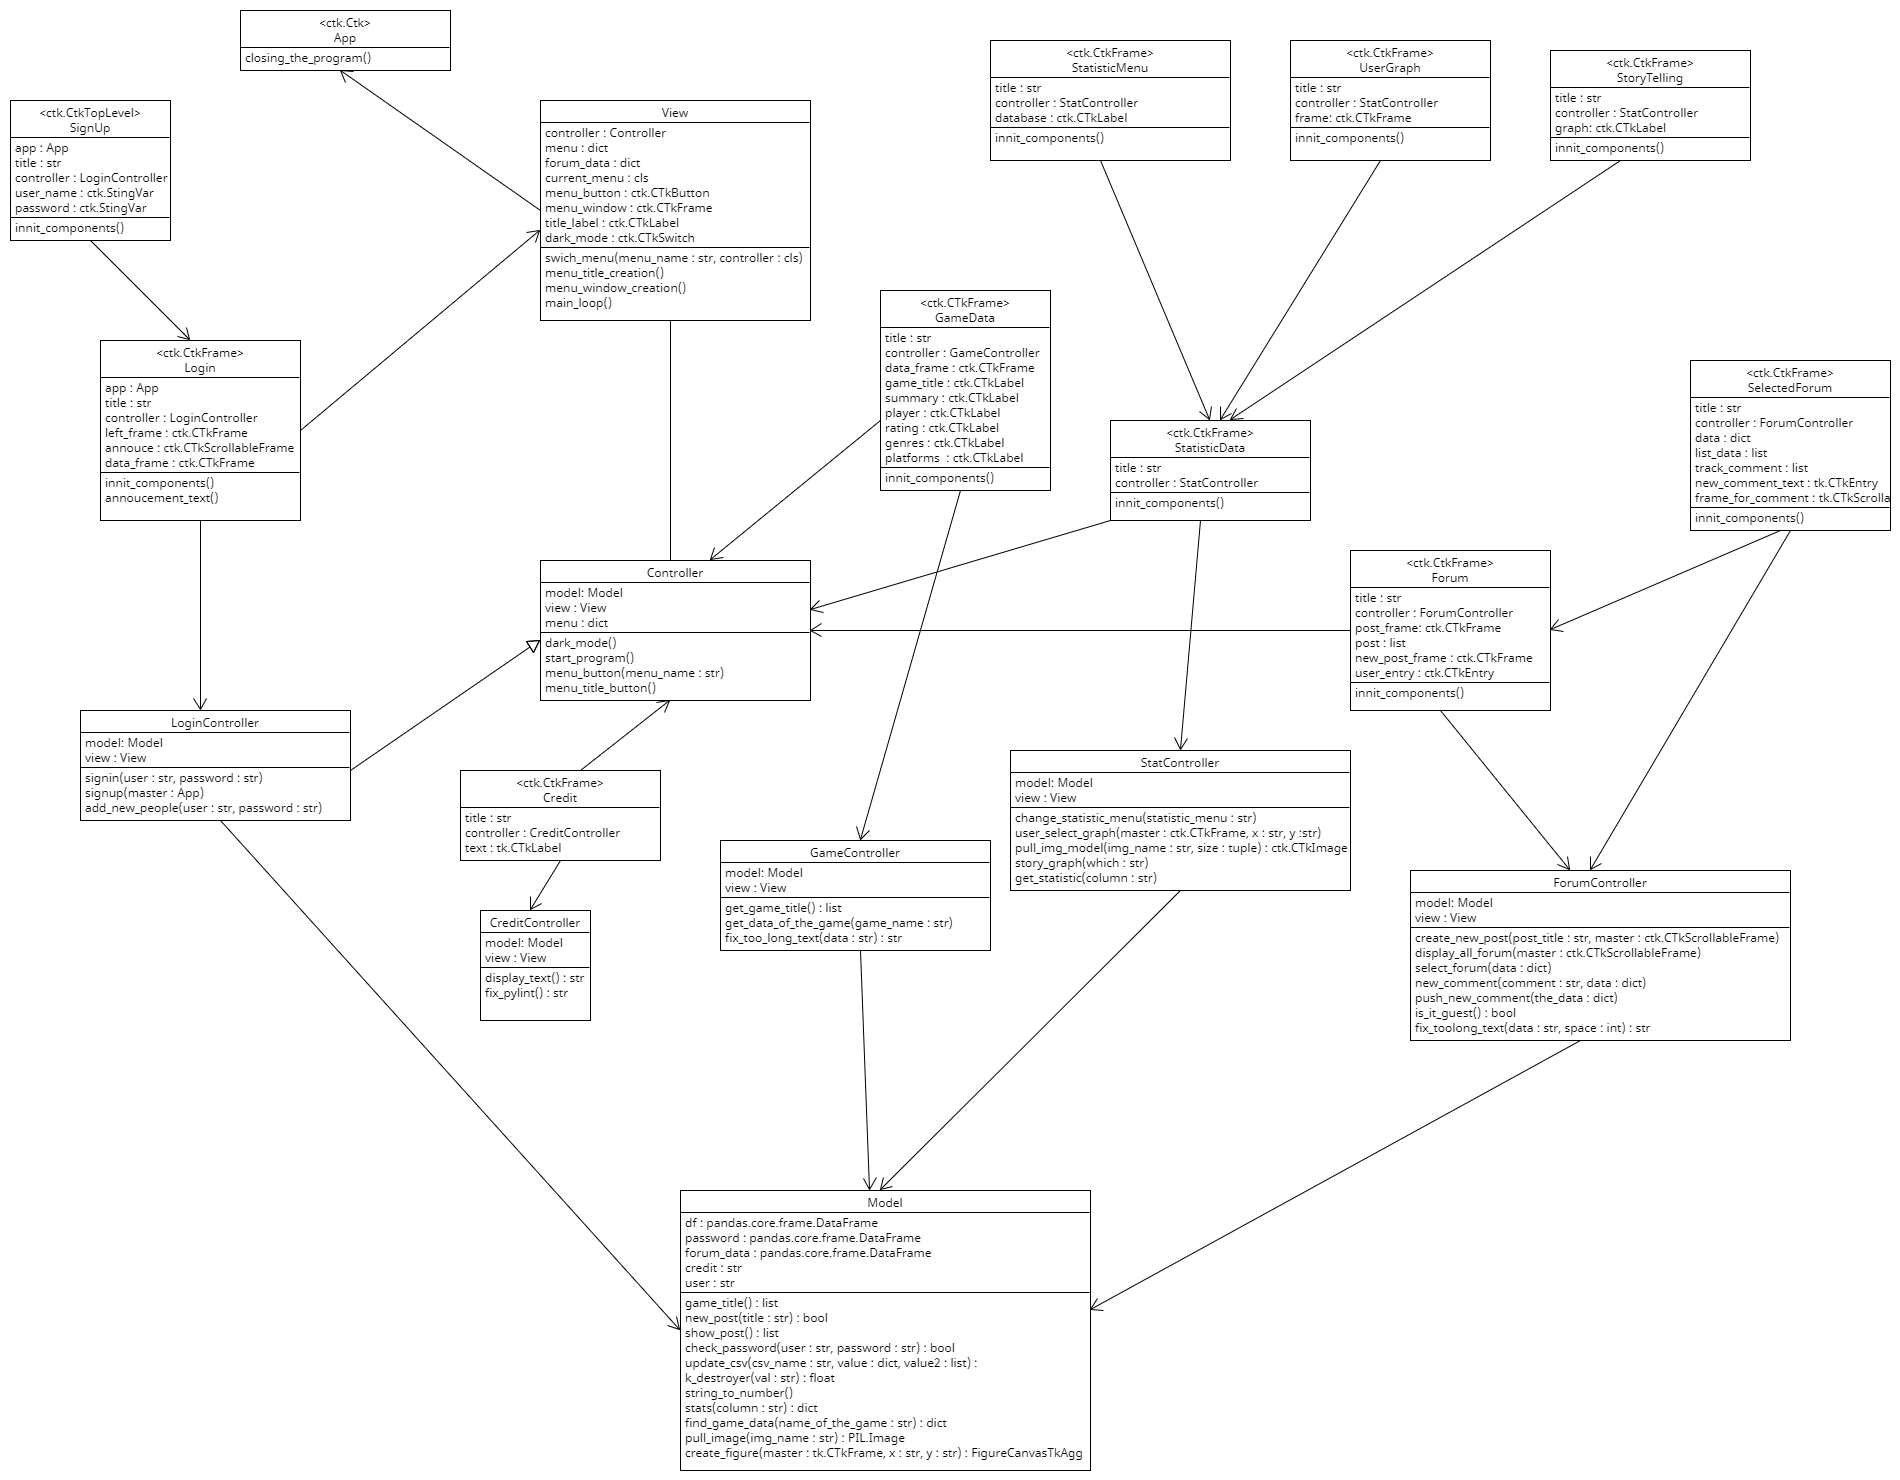
UML Class Diagram
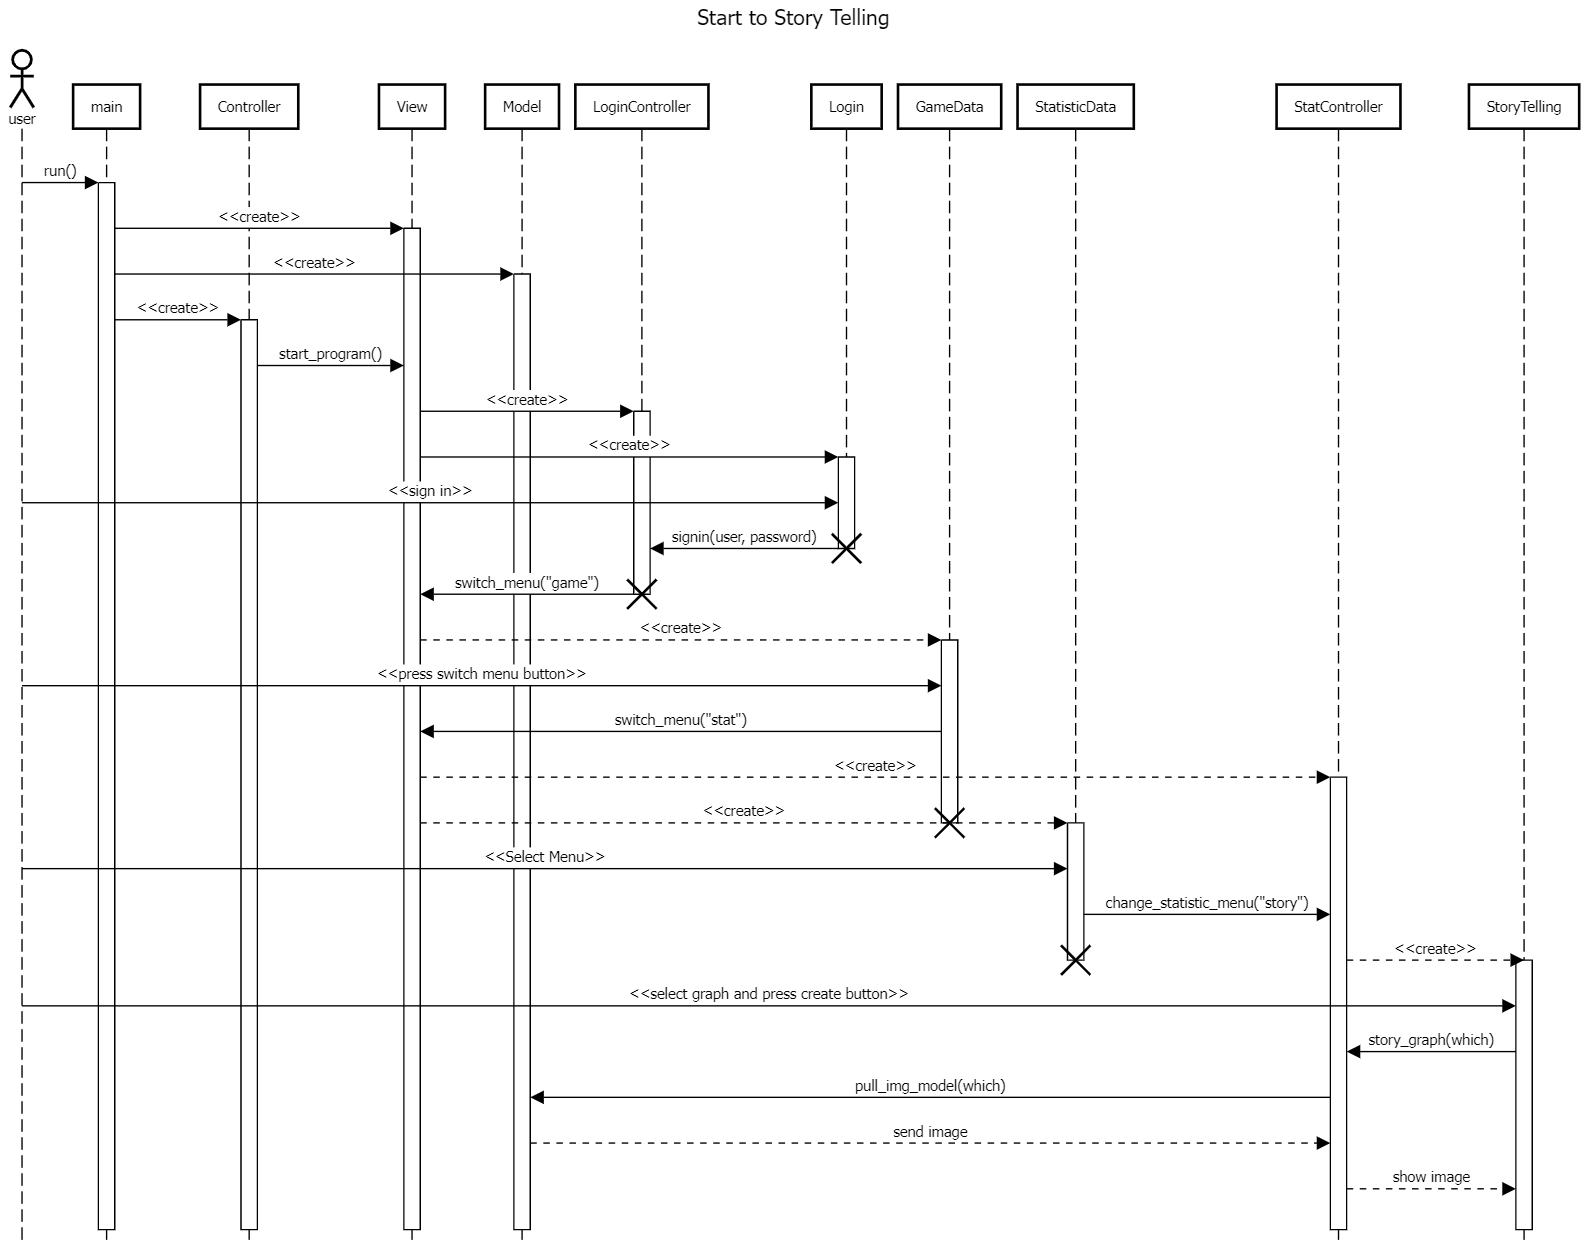
UML Sequence Diagram
Program from start to Storytelling
Installation Guide
-
Clone the project
git clone https://github.com/Ichi1234/The_Game_Rating_Predictor.git
-
Navigate to the project directory
cd The_Game_Rating_Predictor
-
Install the requirements.txt
pip install -r requirements.txt
-
Run the project
python main.py
My Git hub
Description
LaptopPricePredictor is a project focused on utilizing a meticulously cleaned dataset sourced from the 'Smartprix' website, containing information on 991 unique laptops. Enriched with 22 features including laptop brand, model, price, specifications, and more, this dataset serves as a robust foundation for building predictive models and recommendation systems tailored to the diverse needs of laptop consumers.
Requirment
pandas==1.3.3 numpy==1.21.2 matplotlib==3.4.3 seaborn==0.11.2 scikit-learn==0.24.2 tk==0.1.0
Running
Installation
How To Run
-
Clone this repository to your local machine.
-
Navigate to the project directory:
```
cd Future-Laptop-Price-Advisor
```
-
Create and activate a virtual environment:
```
python -m venv venv
```
On Windows:
```

venv\Scripts\activate

```
On macOS and Linux:
```

source venv/bin/activate

```
-
Install the required dependencies:
```
pip install -r requirements.txt
```
-
Start the application:
```
python main.py
```
-
The application should open in a new window. You can now explore the features and functionalities of the Laptop Price Advisor.
SkyVista
Description:
The purpose of this application is to assist users in making informed decisions about their flights and preferred airlines. Through the application, users can explore the relationship between variables such as month and airlines, to identify patterns in flight delays
Data source:
2015 Flight Delays and Cancellations
from Kaggle: Dataset
Installation requirement:
*need to use python 3.12 version
- numpy~=1.26.4
- pandas~=2.2.2
- matplotlib~=3.9.0rc2
- pillow~=10.3.0
- seaborn~=0.13.2
Design pattern: mvc pattern
UML
Repository
Installation and how to run:
- Clone the project
git clone https://github.com/yxzuz/SkyVista
- Change directory
cd SkyVista
- Create a virtual environment (optional)
python -m venv env
- Activate virtual environment On MS Windows use:
.\env\Scripts\activate
On Mac use:
.\env\Scripts\activate
- Install all requirement in requirements.txt and make sure you use python 3.12
pip install -r requirements.txt
- Run main.py
python main.py
Documents
Weather Data Visualization Application
The Weather Data Visualization Application is a user-friendly tool designed to visualize weather data stored in a CSV file. It offers multiple graphing options such as histograms, line charts, and bar charts, allowing users to explore and understand weather patterns effectively.
Introduction
The Weather Data Visualization Application provides a convenient platform for users to interpret weather data through graphical representations. With features like customizable graph titles, labels, and colors, users can tailor their visualizations to suit their specific needs. Additionally, the application offers data comparison functionalities, enabling users to analyze variations across different time periods, locations, or weather conditions. Moreover, users can easily view all data in the CSV file using a table for a comprehensive overview.
How To Run
- Clone the Repository: Clone the repository to your local machine:
git clone https://github.com/dackmer/Weather-Data-Visualization-in-thailand.git - Navigate to the Project Directory: Move into the project directory:
cd Weather-Data-Visualization-in-thailand - Create and Activate a Virtual Environment: Set up and activate a virtual environment:
python -m venv venv source venv/bin/activate # For Linux/Mac venv\Scripts\activate # For Windows - Install Dependencies: Install the required dependencies:
pip install -r requirements.txt - Run the Application: Launch the main menu application:
python main_menu.py - Interact with the GUI: Follow the graphical user interface instructions to interact with the application. To exit, simply close the GUI window or click the "Exit" button.
Github
- https://github.com/dackmer/Weather-Data-Visualization-in-thaland.git
Main Features✔️
Food Data Visualizer was made to help user visualize and analyze people's behavior when choosing and ordering food.
This program lets user be able to :
1. Filter and view data
2. Create and analyze histograms
3. Create and analyze bar graphs
4. See an example data story
5. Analyze descriptive statistics
System Requirements⚙️
- Python >= 3.12
- Other packages in requirement.txt
Data Sourceℹ️
Installation🔧
a. Install git here if you haven't
b. Install python here if you haven't
c. Open Terminal/Command Prompt
- Clone this repository
git clone https://github.com/NoMoneyDev/Food-Delivery-Data-Visualizer.git
- Change directory to this project
cd Food-Delivery-Data-Visualizer
- Create virtual environment
python -m venv env
-
Activate the virtual environment * For Windows:
.\env\Scripts\activate* For macOS or Linux:source env/bin/activate -
Install required packages
pip install -r requirements.txt
- Run main.py
python main.py
DEPTH GPU COMPARISON (DGC) Descriptions DGC is a program for user to find the details about their GPU with measure it averages and have other mode for comparison both of this mode will show user a different type of graph and text to allow user to easy to understand.
Setup
the requirement Package : pip install -r requirements.txt
Python at least 3.10.4 python --version if lower than please consider install the latest version from Python.org
How to run
You can start run the program by using
python main.py
Menu (menu.py) Description On the menu, users will see an overall picture of our dataset on the right, where we chose to present important information as a whole so that the user knows the size of the data and display the key values as a graph, while on the left side, a panel that displays the initials and represents the year of the data available, and two buttons that are responsible for navigating the other two layouts.
CompareMode (compareMode.py) Description : This is compare mode it activates after trigger from event button in menu.py it will top bar and the rest is white background after entry input and press compare it will show the rest component that will show details of both GPU, statistics and visual graph
DetailsMode (detailMode.py) Description : this mode will allow user to find it details about their GPU and show them the important data with short summary and statistics to let our user understand their GPU performance and component.
Pokebuild
The Pokemon Team Builder app helps users create strong and strategic teams for figthing in Pokemon game
Data Sources
The dataset for this project is from Kaggle.
Running the Application
Requirements
To run the application, ensure you have the following dependencies installed:
pandas>=2.2.2 seaborn>=0.13.2 matplotlib>=3.8.4 numpy >=1.26.4
Instructions
Clone the repository:
git clone https://github.com/wannaeattaco/Pokebuilder.git
Create a virtual environment and install dependencies
- Change your directory to Pokebuilder
cd Pokebuilder
- Change your directory to code
cd code
- Create virtual environment using this command.
python -m venv env
- Activate the virtual environment
# On Linux or MacOS
source env/bin/activate

# On MS Windows
env\Scripts\activate
- Installing Dependencies
pip install -r requirements.txt
- Run the application:
python main.py
(For macOS users, use python3 main.py instead of python main.py)
The project aims to provide users with an intuitive interface to explore and analyze happiness trends across countries and regions using data from the World Happiness Report. The UI will include interactive graphs and descriptive statistics to help users gain insights into factors affecting happiness levels.
Main Features
1.Overall page - storytelling page
2.stat page - show summary of descriptive statistics and distribution of the histogram.
3.Correlation page - show relationship between economic factors, happiness sore, and happiness rank
4.Trend page - show change of happiness core, happiness rank, other economic factors
How To Install
- Clone the repository:
git clone https://github.com/marena2004/World-Happiness-Explorer.git
- Navigate to the project directory:
cd World-Happiness-Explorer
cd code
- Create and activate a virtual environment:
python -m venv env
source venv/bin/activate   # On Windows, use venv\Scripts\activate
- Install the required dependencies:
pip install -r requirements.txt
- Run the application:
python main.py
Football Scorers Analyzer
The Football Scorers Analyzer is an application designed to help football enthusiasts analyze and identify trends in football scorers' performance. The application provides functionalities to summarize the data, show descriptive statistics, and visualize the data through distribution graphs.
Application Features
-
Data Storytelling : Summarize the data by using descriptive statistics, correlation, and performance and trends analysis.
-
Descriptive Statistics: Show descriptive statistics such as mean, median, min, max, etc., for different attributes of football scorers' data.
-
Correlation: Show the correlation between goals with other attributes like expected goals, shots, and on-target shots.
-
Distribution Graph: Show distribution graphs for attributes including goals, expected goals, shots, and on-target shots to understand the distribution of data.
-
Performance and Trends: Analyze the performance of football players to identify trends and also compare the performance of players.
-
Navigation Bar: Navigate between different functionalities and features of the application.
Data Source
The data used in the application is collected from the Kaggle dataset which contains the top football leagues' scorers data.
Project Documentation
GitHub Repository
Requirements
- Python 3.10 or higher
- Required Python packages specified in
requirements.txt - pandas
- matplotlib
- numpy
- seaborn
Installation and Usage
- Clone the repository:
git clone https://github.com/PatChirapat/Football-Scorer-Analyzer.git - Change the directory:
cd Football-Scorer-Analyzer - Create a virtual environment:
for Windows:
python -m venv venv
    venv\Scripts\activate
for MacOS/Linux:python3 -m venv venv source venv/bin/activate - Install the required packages:
pip install -r requirements.txt - Run the application:
python main.py
NextPage
Introduction
NextPage is an application designed to enrich the reading experience by utilizing data visualization and personalized book recommendations. By leveraging the Goodreads dataset, the project aims to provide users with insights into book trends and reader preferences, helping them discover books that match their interests.
Data
- Source: Kaggle.
Github: 1stChaS
Main Features
- Data Visualization: Offers valuable insights into book trends and reader preferences, helping users make informed decisions about their next reads.
- Filtering: Allows users to explore books based on various criteria such as genre, rating, and more, enabling a tailored browsing experience.
- Book Recommendation System: Utilizes similarity calculations based on rating and genre to recommend a curated list of 10 books that the user is likely to enjoy.
Running the Application
Requirements
Ensure you have all necessary dependencies installed to use the application. For detailed dependency information, please refer to the requirements.txt file.
Setup Instructions
Clone the repository:
git clone https://github.com/1stChaS/NextPage.git
Create a virtual environment and install dependencies
- Change your directory to NextPage
cd NextPage
- Create virtual environment using this command.
python -m venv env
- Activate the virtual environment On Linux or MacOS
source env/bin/activate
On MS Windows
env\Scripts\activate
- Installing Dependencies
pip install -r requirements.txt
- Run the application:
python main.py
Diabetes-Checker
A visualization program designed to help users check their risk levels for diabetes. This tool can provide valuable insights into potential health risks and assist users in making informed decisions about their well-being.
Resource
This project uses dataset from kaggle.com
Information table image sources BMI, Blood pressure, Age, and Glucose
Files
file | Description
application.py | The class for controlling both UI and Model.
diabetes_model.py | The model class that loads and computes data.
diabetes_view.py | The GUI class for the user interface.
main.py | Main script to run the program.
data | Folder containing pictures and data for the model to compute and UI to display.
Example UI
Windows and macOS are only slightly different when it comes to menubar.
Tab Example
Home(Dark Mode) 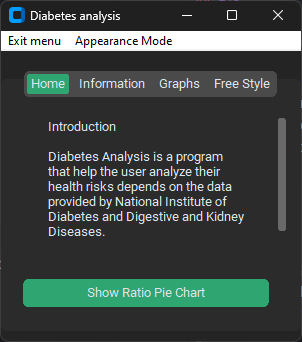
Home(Light Mode)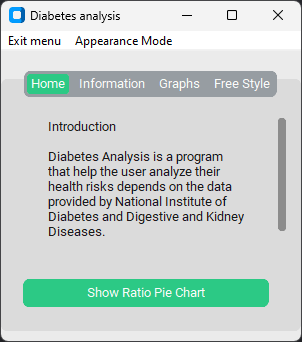
Diagrams
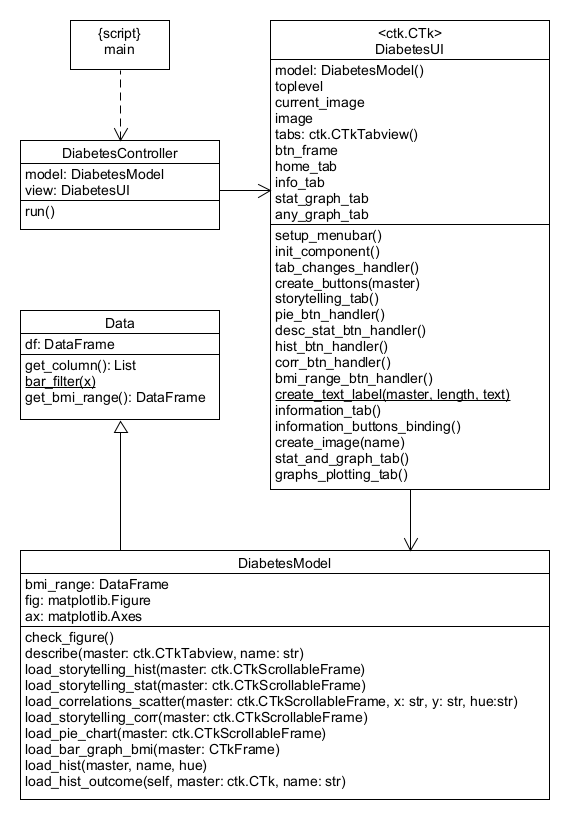
UML Class Diagram
Installation and How to run
Installation
-
Open Terminal (macOS/Linux) or Powershell/Command Prompt (Windows).
-
Clone files from GitHub repository.
git clone https://github.com/PeanutPK/Diabetes-Analysis.git
- After cloning changes your directory to the existing folder.
cd Diabetes-Analysis
- Install all requirements in requirements.txt.
pip install -r requirements.txt
- Run main.py file
python main.py
GitHub link
FIFA World Cup 2022 Teams analyzer
This project is for showing the statistics and relationships between the teams that participated in the FIFA World Cup 2022.
Preview There are 4 pages total.
| Statistic page |  |
|---|---|
| Teams page |  |
| Relationship page |  |
| Story page |  |
Wiki Page
Homepage: https://github.com/jee-gamer/FIFA-World-Cup-2022-Teams-analyzer/wiki
How to install: https://github.com/jee-gamer/FIFA-World-Cup-2022-Teams-analyzer/wiki/Installation
Github repo
https://github.com/jee-gamer/FIFA-World-Cup-2022-Teams-analyzer
Welcome to Korean-SoapOpera
Assuming you are an investor interested in Korean Drama industry, let’s see the graph for whether or not this industry is good for investment. There would be two menus which are Story-Telling and Graph menu.
Software Requirement:
- Python version = 3.11
Data Source:
Project Document:
Installation
Clone the repository
git clone https://github.com/Fahsairvw/Korean-Soapopera.git
Go to Directory
cd Korean-Soapopera
Step how to run the code
User starts the virtual in the virtual env.
python -m venv venv
Activate the virtual env on Linux and MacOS
source venv/bin/activate
Or, on MS Windows:
.\venv\Scripts\activate
Install requirement
pip install -r requirements.txt
Run program
python main.py
PC Part Picker
This project aims to assist users in finding the best computer parts for their PC within their assigned budget. The program will provide an informative graph to compare each selected part, aiding users in deciding which component best suits their needs. Building a computer can be confusing, especially for those lacking expertise in the field.
Data Recourse
Every dataset source : Kaggle.com
Required Files
main.py - Contain main code to run the program
processing.py - Process the data such as converting from USD to THB
product_value.py - Contains Enum classes
Program_UI.py - Contains UI of the program
CPUData.csv - Dataset of CPU
GPUData.csv - Dataset of GPU
HDDData.csv - Dataset of HDD
SSDData.csv - Dataset of SSD
RAMData.csv - Dataset of RAM
MotherboardData.csv - Dataset of Motherboard
Installation guide
- Open Terminal or Command prompt
-
Clone GitHub Repo -
commandline git clone https://github.com/PichapopRo/Year1-Project.git -
Go in the directory
commandlinecd Year1-Project4. Install all requirement packages in requirements.txt.commandline pip install requirements.txt
- Run main.py file
commandline python main.py
Github Page:
Indian-flight-visualizer
A program to visualize flight data in the region of India
description
A program that shows available flights from a pair of airports and shows factors which affects flight price. As well as graphs of flight price data to show the correlation between factors such as Airline, number of stops and time of day on the price of the flight.
Installation
- clone the repository
https://github.com/KhunakornP/Indian-flight-visualizer.git - navigate to the directory
cd Indian-flight-visualizer
How to run the program
- Create a virtual environment (Optional)
python -m venv env - Activate the virtual environment (Skip if skipping step 1)
.env/bin/activate
on windows use
.\env\Scripts\activate
- Install dependencies
pip install -r requirements.txt
- Run the program
python main.py
wiki
https://github.com/KhunakornP/Indian-flight-visualizer/wiki
Dataset
repository
UK Flight
A program to compute and show statistics of flight routes from the United Kingdom to anywhere in the world. It can also find how to go from origin airports in the UK to destinations airports all over the world.
Screenshots
Data Storytelling Page

Other pages
The screenshots for other pages are available at the README.md file
How to install
Please refer to this wiki page.
How to run
python main.py
References
GitHub Link
Steam Game Market Analysis
Description
This application summarizes information about the video game market based on data from the Steam store. It provides users with tools to explore the data through:
- Plotting graphs: Visualize trends and relationships in the data.
- Viewing specific video game details: Get in-depth information about individual games.
Required Packages
same as requirement.txt
- matplotlib>=3.8.4
- numpy>=1.26.4
- pandas>=2.2.2
- Pillow>=10.3.0
- Requests>=2.31.0
DataSource
The data used in this application originates from the Steam Games Dataset on Kaggle:
Kaggle.com
The dataset is licensed under the MIT License (see THIRD-PARTY-LICENSE for details).
Application Detail
Information Page This page consist the datastory telling part.
Explore Page allow user to change the attribute of the graph and filter by themselves.
-
Select the dataframe you want to visualize
-
Filter the data by using the set of filter condition in the combobox
-
Select the Graph type and its attribute
-
Press Visualize button
Single Data Page Let User read the data of the specified videos game and add the specific game to the dataframe.
-
Select specific games
-
Add the dataframe name to the buttom combobox
-
Press add button to add the video game into the new dataframe
Supercar choosing helper and analysis 🏎️
This project will create the supercar choosing helper and analysis to help users make a decision about the supercar or see information about the supercar. By showing descriptive statistics and graphs based on user's input.
Data used: Link to data source
Link to GitHub repository: Link to repository
Embark on your YouTube journey with our toolkit featuring three menus: Storytelling for insights, Explore Data for creativity, and YouTuber Suggestions for mentorship, guiding you towards success in the dynamic world of online content creation.
Require package
- pandas~=2.2.2
- seaborn~=0.13.2
- matplotlib~=3.8.4
Data source: click here
Project Wiki: click here
Project Proposal: click here
How to install: click here
UML Diagram: click here
Sequence Diagram: click here
Japanese show recommendation system
What it does
This project aims to recommend a Japanese animated show (hereafter referred to as “the show” or “Anime”) to users based on their input of preferred shows. Users can further add additional criteria to the recommendation system, enhancing their satisfaction. The program contains a watch list function in which the user can save their recommended shows.
In addition, this program will allow the user to investigate the insight of the shows’ data, enhancing their ability to decide on their next show by providing users with data visualization. The examples of the intuition that the user will get from these data visualizations are: ‘What is the over-rating of anime in this genre’, ‘Does the score affect the percentage of people being able to finish the show or not’ or ‘What is the share of each type of anime in the list recommended shows.
Installation
git clone https://github.com/knilios/Japanese-animated-show-recommendation-system.git
cd Japanese-animated-show-recommendation-system
python -m pip install -r requirements. txt
How to run
python main.py
Links to documents
Proposal - https://docs.google.com/document/d/1Qi0fGU4koof8QgauWVlN8KqHx2hm2YZaUMJ7Gj5Uqrs/edit?usp=sharing
data source: https://www.kaggle.com/datasets/hernan4444/anime-recommendation-database-2020
Requirements
python version 3.11 or greater
Description
The project involves analyzing a dataset containing information about various laptops. The goal is to assist users in making informed decisions when choosing between different laptop options. Through data analysis, key factors such as performance, price, brand, and others will be evaluated to provide recommendations tailored to users' needs and preferences.
Data
Laptop price data set from kaggle
example UI
UML Diagram
Installation
- Clone the project
git clone https://github.com/Bezzilla/Laptop_price.git
- Change directory
cd Laptop_price
- Install requirements
pip install -r requirements.txt
- Run
python laptop_app.py
Flight within USA Displayer
A program to compute and show delay information about US flights based on data from January 2020 (around 500k flights). The information includes departure delay, arrival delay, percentage of diverted flights, and percentage of canceled flights.
Main features
- User can select subsets of data to view graphs and statistics
- 3 graphs per tab (Average delay time, Percentage of on-time flight, Percentage of flight in each time block)
Requirements
Requires Python 3.8 or newer. Required Python packages are listed in requirements.txt
pandas>=2.2.1
matplotlib>=3.8.4
numpy>=1.25.2
How to run
- Navigate to the directory where you placed the project files
- Install all requirements in requirements.txt.
pip install -r requirements.txt - Run main.py file
python main.py
Sources of data
US Airline Dataset
January Flight Delay Prediction
GitHub
Cereal Nutrition Visualizer
This project aims to visualize the cereal nutrition according to nutrition fact. You can also see each cereal nutrition individually.
Data source
This project use dataset of 80 cereals from kaggle.com
Files
- main.py
- cereal.csv
- dashboard_ui.py
- nutrition.py
- README.md
- requirements.txt
How to install
Minimum Python version required: >=3.9
Requirements
- pandas
- numpy
- matplotlib
- matplotlib[tkagg]
How to install
- Clone the project
git clone https://github.com/SariyaP/Year-Project.git
- Change to project directory
cd Year-Project
- Install the requirements.txt
pip install -r requirements.txt
- Run the project
python main.py
Create Virtual Environments
- Open command prompt
- Change to project directory
cd Year-Project
- Create Virtual Environment
python -m venv env
Activate Virtual Environment
- Open command prompt
- Change to project directory
cd Year-Project
- Activate venv
for macOS
source env/bin/activate for Windows env\Scripts\activateg Installation.md…]()
Client Information for Bank A mocked-up program is used for the Computer Programming II course at Kasetsart University
This application is used to see the bank's client information for the bank manager to make statistic
Requirements Requires Python 3.8 or newer. Required Python packages are listed in requirements.txt.
Configure the Application Download the code to a local directory using either git clone or a ZIP file provided by Github.
Running the Application Open this repository on your own computer Run this repo by main.py Project Documents All project-related documents are in the Project Wiki
ProjectProposal UML-Diagram
Source Banking Dataset https://www.kaggle.com/datasets/prakharrathi25/banking-dataset-marketing-targets
Stock-Analysis
Description
- This application will analyze the top ten performing stock data by Yahoo!Finance for investors and provide the tendency and volatility of each stock using descriptive statistics and correlation. This helps investors decide whether they should invest or not. Additionally, the application will display essential graphs such as line, bar, and scatter plots.
Datasource
- The Dataset of this program is provided by yahoo! Finance API
here
that contain record of each company stock value by date-time.
How to run
The package needed for this program, yoo can install in requirements.txt file by the command pip install -r requirements.txt Then you can run the program in file main.py
Design Pattern
- facade pattern
- MVC pattern
Application features
- Showing graph and Compare attribute: On the main page, the program will display the graph according to the user interaction.
- Descriptive Statistics: Show the descriptive statistics of the user's selection attributes.
- Distribution: Show the distribution graph of volume in each of stock.
- DataStorytelling Show the line graph of open, high and low prices over the period, the program will display the scatter plot between closing price and volume attributes as well as showing the sales of volume representing by bar graph.
- Attribute Relationship: This feature is will show the scatter plot graph and compute the coefficient correlation between the user's selection attributes.
Design Pattern, UML and Sequence Diagrapm
Design pattern that I used is MVC. by getting the user selected from StockUI. then calling StockController to use the function in StockModel
More information: Project Proposal
Board Game Searcher
A table contains the data of board games from kaggle
This application is for searching a board game by given column also comes with sort. It also presents some statistic and graph in "Graph" page
Requirements
Python version 3.10.11 or better is required and the required python packages are list in requirements.txt
Installation and set up virtual environment
See installation
Brief instruction:
1. Download the code to local directory and do the next step in the directory where the downloaded files are in
2. Create virtual environment virtualenv env
3. Activate virtual environment env\Scripts\activate (Windows) and install the required packages pip install -r requirements.txt
Running the application
- After done the installation part above run the command
python searcher_app.pyto start the application - When done and want to exit virtual environment do
deactivateto exit
Documents
Project-related documents can be found here
Link to repo
Air Quality Analysis Tool
Overview
A Tkinter-based Python application that utilizes daily PM2.5 data to provide users with insights into air quality trends in Bangkok, empowering them to make informed decisions about their health and activities
Required Data Files
pm25_data.csvtemperature_data.csvhumidity_data.csv
Installation
- Clone the repository:
- git clone https://github.com/your_username/air-quality-analysis-tool.git
- Navigate to the project directory:
- Create and activate a Python virtual environment:
-python3 -m venv venv
- . env/bin/activate # For Unix/Mac
- .\env\Scripts\activate # For Windows
- Install the required packages:
- pip install -r requirements.txt
- Run the application:
- python main.py
For installation instructions, please refer to Installation. The Air Quality Analysis Tool is a Python application designed to analyze and visualize air quality data. It provides functionalities for loading data, displaying statistics, and generating visualizations such as graphs and charts.
Features
-
Data Loading: Load air quality data from CSV files (
pm25_data.csv,temperature_data.csv,humidity_data.csv). -
Statistics: Display statistics for PM2.5, temperature, and humidity data including mean, median, minimum, and maximum values.
-
Visualizations:
- Pie chart: Display distribution of PM2.5 categories.
- Histogram: Visualize distribution of PM2.5 concentration.
- Line graph: Show variation of PM2.5, temperature, and humidity over time.
- Scatter plot: Display correlation between PM2.5 and other variables like temperature and humidity.
-
Nearest Station: Find the nearest station based on latitude and longitude coordinates.
Seasonal Trends
This project “Seasonal Trends” aims to analyze the dataset to see seasonal sales and how items in each category have been selling in that season by visualizing it using graphs such as Histograms, Pie charts, or Bar graphs and provide detailed information to help users with decision-making in restocking or make some promotion of it.
Resource
The Customer Shopping Trends Dataset from kaggle.com
Main Features
- 2 Page 1. Analyze Storytelling page
- General information - This page contains some description and default graph Users can see which items are selling well in the season by the visualization. Users can see other information that may not be related to the season like overall of it Ex. How many items of different colors were sold?
Installation Guide
-
Clone the project
git clone https://github.com/Nunthapop123/Year1-project.git
-
Navigate to the project directory
cd Year1-project
-
Install the requirements.txt
pip install -r requirements.txt
-
Run the project
python main.py
My github Github
Playstation
Description
This project is an application that shows a database of all current PS5 games with historical_deals.csv, which includes information on name, publisher, link, discount percentage, original price, discount price, discount end time, rating, amount of rating, genre, and release date. In my application, You can find interesting games and visit the PS5 official website for more information. You can also use the data to analyze graphs. Users can choose the type of graph and see data storytelling that i represent
Requirements
pip==23.3
numpy==1.26.4
pandas==2.2.2
matplotlib==3.8.4
seaborn==0.13.2
Installation
step1: git clone https://github.com/tanasatit/Year1-Project-tanasatit.git
step2: Create new virtual environment - python -m venv env
step3: Activate virtual environment - . env/bin/activate
step4: Install required modules - pip install -r requirements.txt
step5: Run main file - python main.py
Dataset
https://www.kaggle.com/datasets/crxxom/ps5-discount-games
ApplicationUI
Info page

visit website

Statistic page

Data Storytelling page

Description
The program is designed to help users find the ideal dog breed by exploring traits through graphs and offering personalized recommendations. It simplifies the breed selection process by enabling users to view and compare characteristics of various breeds and receive customized suggestions based on their preferences.
Main features
- Find Matching Breeds: This feature recommends dog breeds that align with the user's preferences. Users can specify how important each characteristic is to them. Before entering their preferences, users are presented with a storytelling page that shares insightful, data-driven stories about dog ownership.
- Statistical Information: This function provides detailed information about each dog breed. Users can select specific attributes of a breed to explore statistical data, helping them make informed decisions.
- Characteristic Comparison: Allows users to compare the characteristics of two chosen dog breeds side by side. This feature aids in highlighting differences and similarities, assisting users in distinguishing which breed may be better suited to their needs.
Requirements
Python 3.11 and python packages listed in requirements.txt.
Projects Documents
Sources of data
Github Link
MoviePicks Project
Description
MoviePicks is a movie-finding and analysis app that helps users find movies they like. Based on the top 10,000 popular movies from TMDB, this application analyzes the revenue, budget, and characteristics of movies, and allows users to search for movies based on their preferred genres and ratings.
How to install
- Clone the repository:
git clone https://github.com/tarothanawat/MoviePicks_Project.git - Navigate to the project directory:
cd MoviePicks_project - Create a virtual environment:
python -m venv env - Install the required packages:
pip install -r requirements.txt - Run the application:
python main.py - Enjoy!
UML Diagrams
Source
Link to GitHub
Melbourne Housing Market Analysis
This repository contains a Python application for analyzing the Melbourne housing market. It provides functionalities for importing data, performing descriptive statistics, visualizing data, predicting prices, and comparing houses.
Features
- Import Data: Import housing data from CSV files.
- Descriptive Statistics: Display descriptive statistics such as mean, median, min, max, etc., for selected attributes.
- Data Visualization: Visualize housing data through various histograms.
- Compare Houses: Compare details of two selected houses.
UML Diagram

Requirements
- Python 3.10+
- Libraries: tkinter, pandas, matplotlib, networkx
Installation
-
Clone the repository:
git clone <repository_url> -
Install dependencies:
pip install -r requirements.txt
Usage
-
Run the application:
python main.py -
Use the GUI to perform various tasks like importing data, displaying statistics, visualizing data, predicting prices, and comparing houses.
Structure
- housingView.py: Contains the GUI implementation using tkinter for the Melbourne housing view.
- housingController.py: Implements the controller logic to interact between the model and view.
- housingModel.py: Defines the data model for the Melbourne housing market.
Contributing
Contributions are welcome! If you have suggestions, bug reports, or feature requests, please open an issue or create a pull request.
License
This project is licensed under the MIT License.
Feel free to adjust and expand it according to your preferences and the specific needs of your project!
WorldData
WorldData is a Python-based app with a GUI interface. This app provides general data on 195 countries worldwide, allowing users to view statistics on various attributes through visualization, including various types of graphs. Here's some GUI in this application, see more in Wiki.
GUI Interface
Data Source
This project using Global Country Information Dataset 2023 as a data source. (This data has some errors, such as errors in country names, but I have already fixed them. Additionally, I have added the region of each country to the data.)
Running the Application
Requirements
The program needs to be run with the following packages installed (that are in requirements.txt):
- customtkinter==5.2.2
- matplotlib==3.8.4
- pandas==2.2.2
- pillow==10.3.0
- numpy==1.26.4
- networkx==3.3
How to run the program
- Clone the repository
git clone https://github.com/KikyoBRV/WorldData.git
- Change your directory to WorldData
cd WorldData
- Create virtual environment
py -m virtualenv env
- Activate the virtual environment
On Linux or MacOS
source env/bin/activate
On MS Windows
env\Scripts\activate
- Installing requirement library
pip install -r requirements.txt
- Run the application
On MacOS
python3 main.py
On MS Windows
python main.py
GitHub Link
Airline Route Mapper
This project provides users with the ability to determine the shortest route considering the distances between airports. The interface offers a visualization of the route on a map, along with detailed information about the airports involved and the calculated distance.
Plotting graphs: Visualize trends and relationships in the data. Viewing specific video game details: Get in-depth information about individual games.
Requirements
same as requirement.txt: pandas==2.2.2, folium==0.12.1, seaborn==0.13.2, matplotlib==3.8.4, numpy==1.26.4
How to Run
1.Install Dependencies: Make sure you have Python installed on your system. You will need to install the following Python packages: pip install pandas folium
2.Download the Repository: Clone or download the repository to your local machine.
3.Prepare Data: Ensure you have the following CSV files in the project directory: airports.csv,routes.csv,runways.csv
4.Run the Application: Open a terminal or command prompt, navigate to the project directory, and run the following command: python mapper_gui.py
5.Input Origin and Destination: Enter the IDs of the origin and destination airports in the respective entry fields.
6.Calculate Route: Click on the "Calculate Route" button to find the shortest path between the specified airports.
7.View Route Details: The application will display detailed information about the origin and destination airports, including their IDs, cities, and countries.
8.Display Route on Map: Click on the "Show Map" button to visualize the calculated route on a map by showing the pin of origin and destination.
9.Interact with Map: You can interact with the map to zoom in/out and pan around to explore the route.
10.Exit the Application: Close the application window when done.
Github
- https://github.com/Kantapon2547/Airline-Route-Mapper
MyAnimeList-Explorer
MyAnimeList Explorer is a program that process and visualize anime data with various kind of graph, and also finding anime information that you are interested with.
Data Sources
How to Run
- Clone this repository to your device directory.
- Create and activate a Python Virtual Environment.
- Install required packages mentioned in requirements.txt
- Run the program
- Full detail on how to install: Github Installation
MyAnimeList Explorer UI
Explore page


Information page


Data Story page

Requirements
Related sites
Quality of Life by country
Description
There are three parts of my project. The first section contains data on quality of life, which is presented in three formats: table data, data for each country, and descriptive data. You can get information on each country's quality of life index, along with other variables considered while calculating it, by looking at table data and data by country. In the second part is data storytelling, I provide my analysis from the data regarding how the country's standard of education affects people's quality of life. In the third section, you can create your own graph by selecting the graph type and other necessary attributes.
Requirements
Requires Python 3.8 or newer. Required Python packages are listed in requirements.txt.
Project Documents
Data Source
-
Quality of Life
-
Data of each country
GitHub project
UFORadarSEA
Description
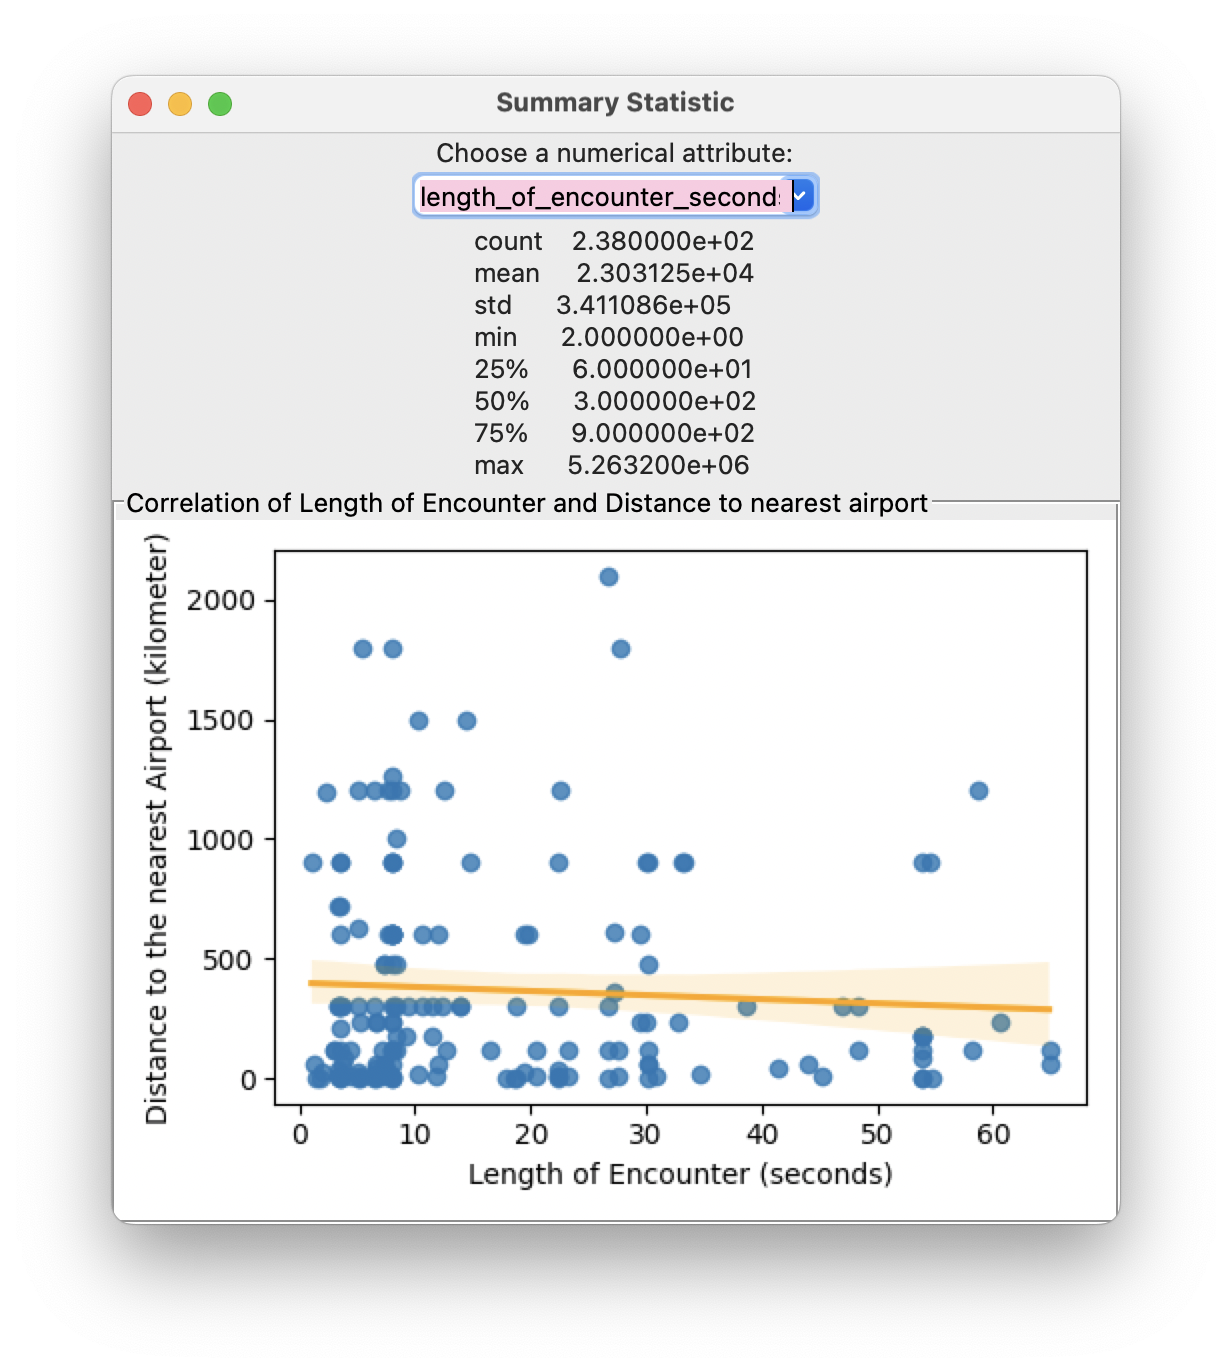
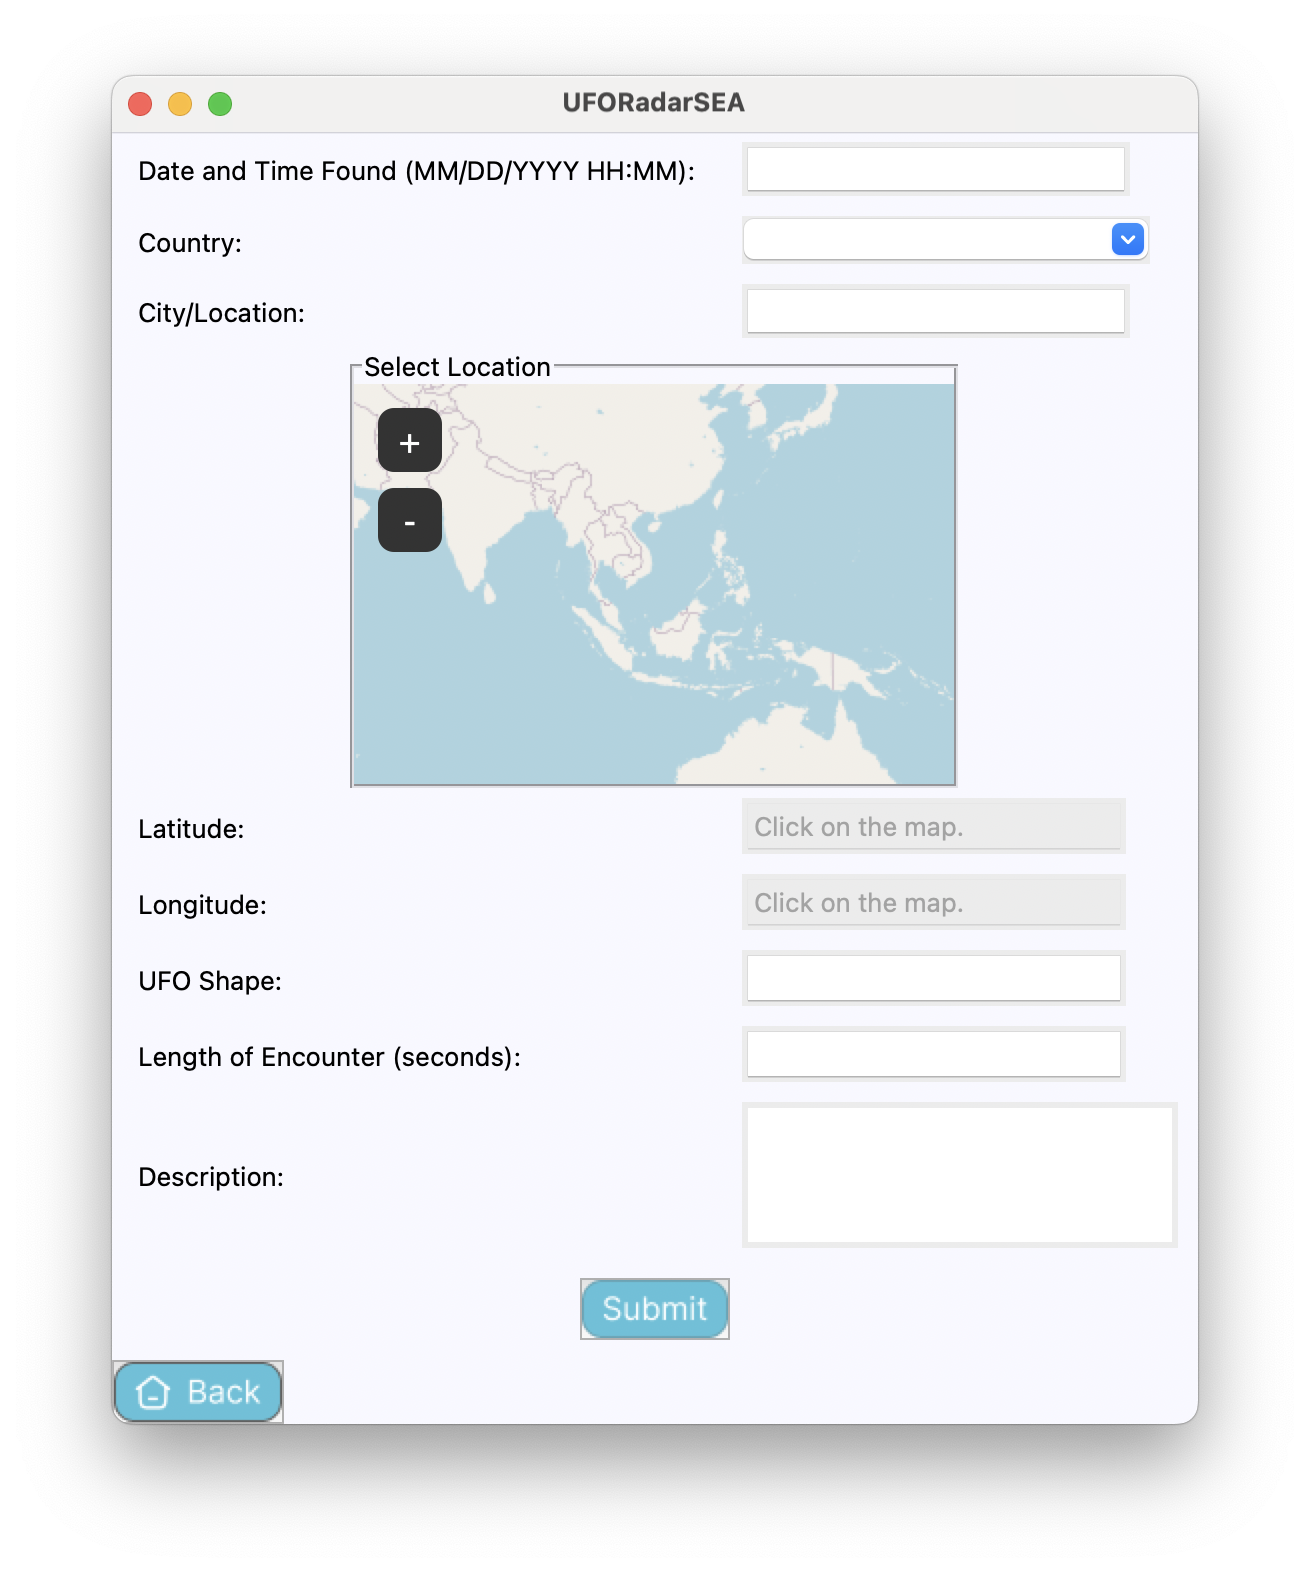
The UFORadarSEA is a desktop GUI application built using Python's Tkinter library. It allows users to explore UFO sighting data in Southeast Asia, create custom graphs based on various attributes, and submit new UFO sighting reports.
Main Features
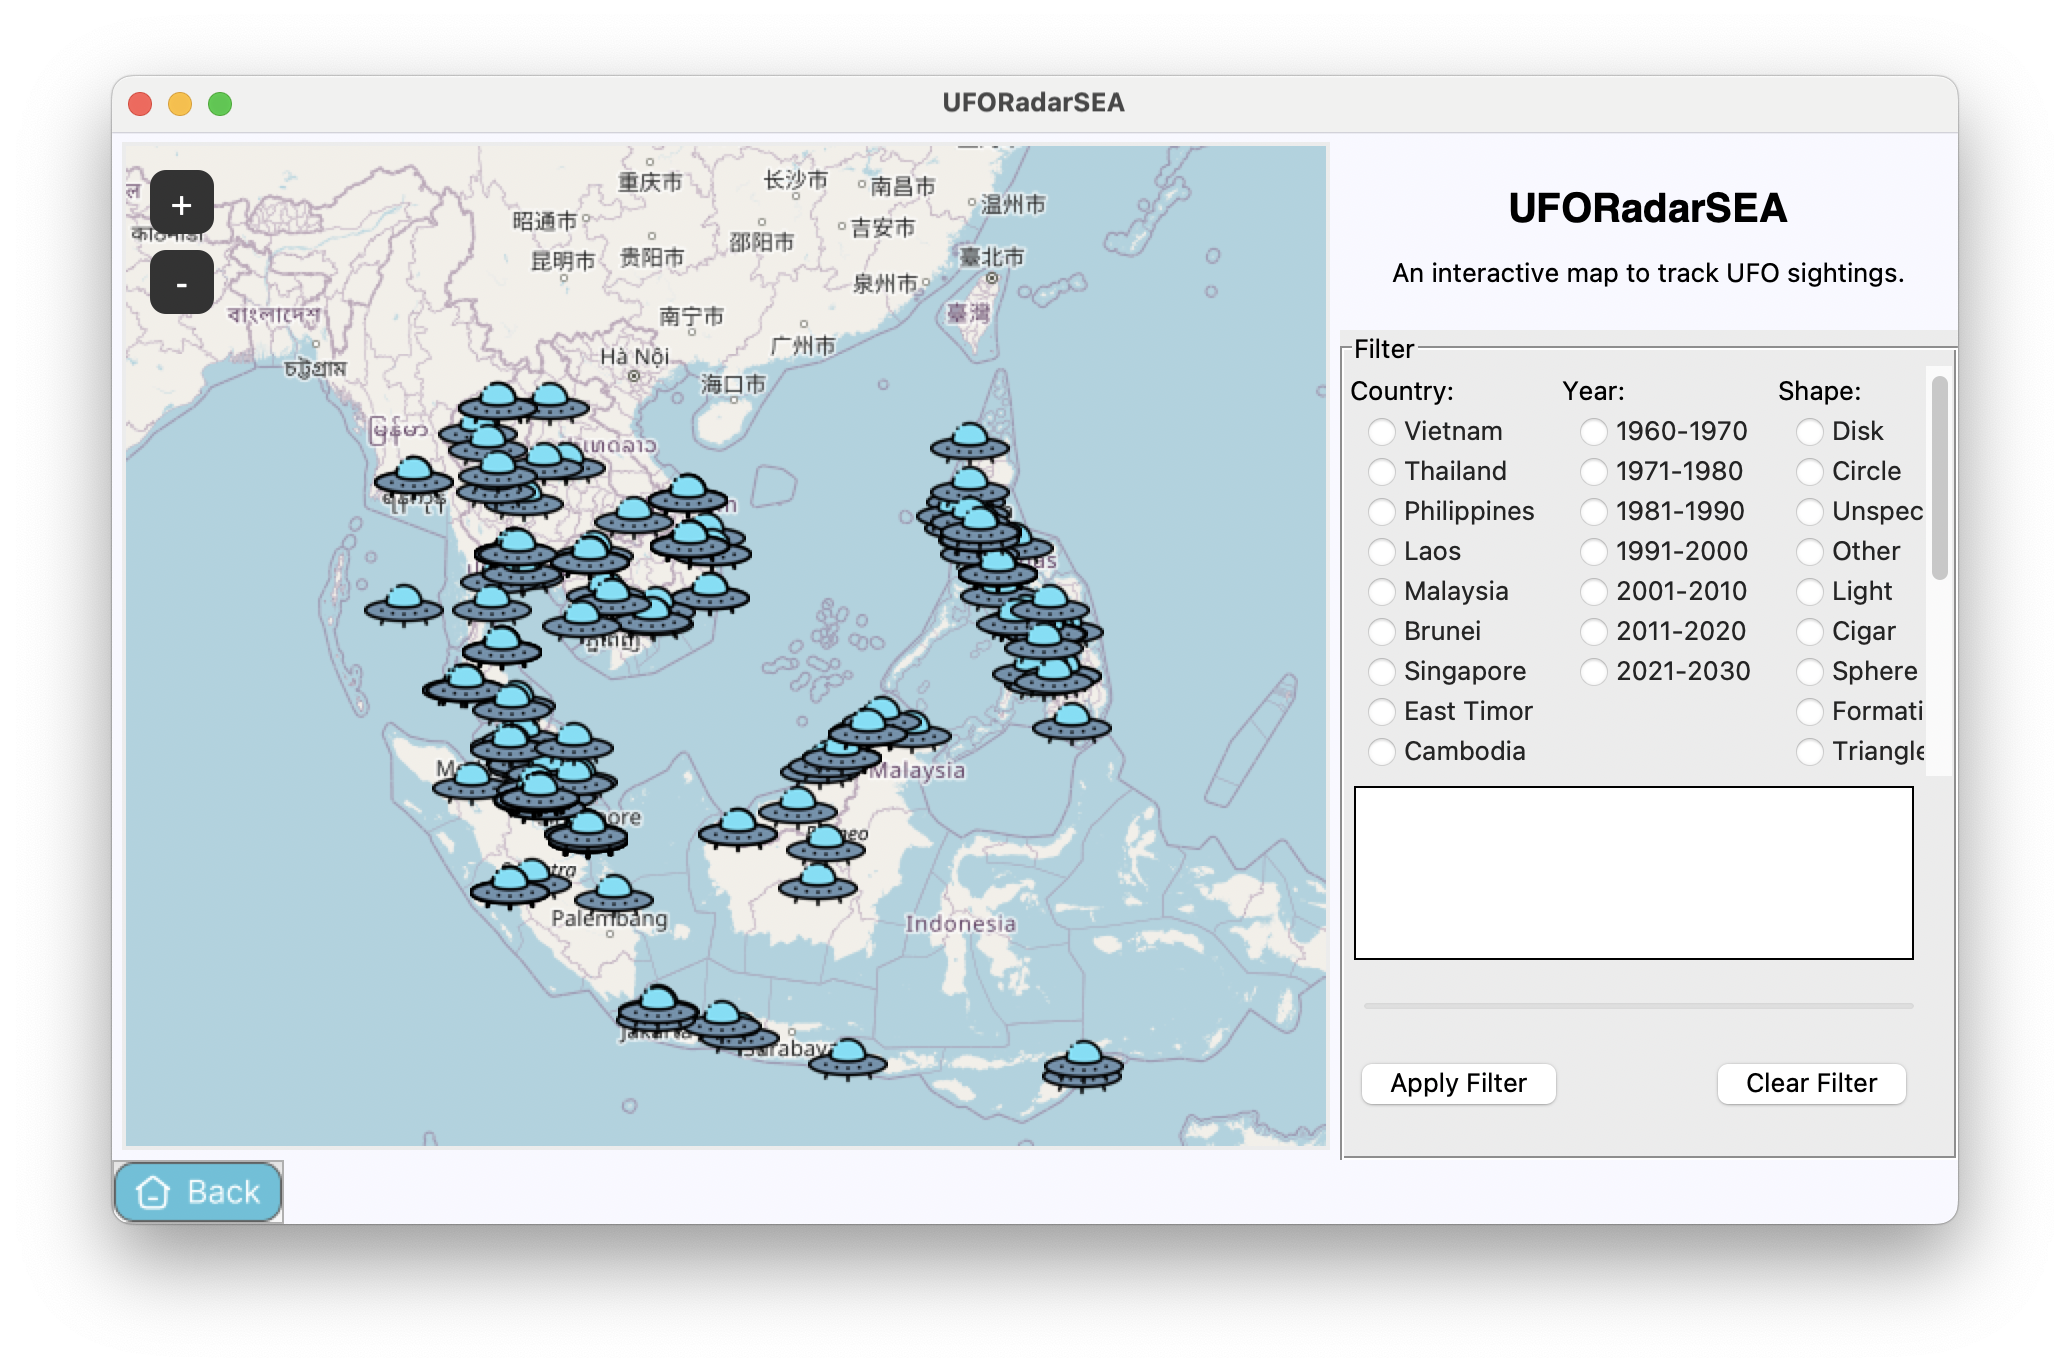
- View UFO sighting reports on a map. (View Map Page)
- Filter reports based on various criteria. (View Map Page)
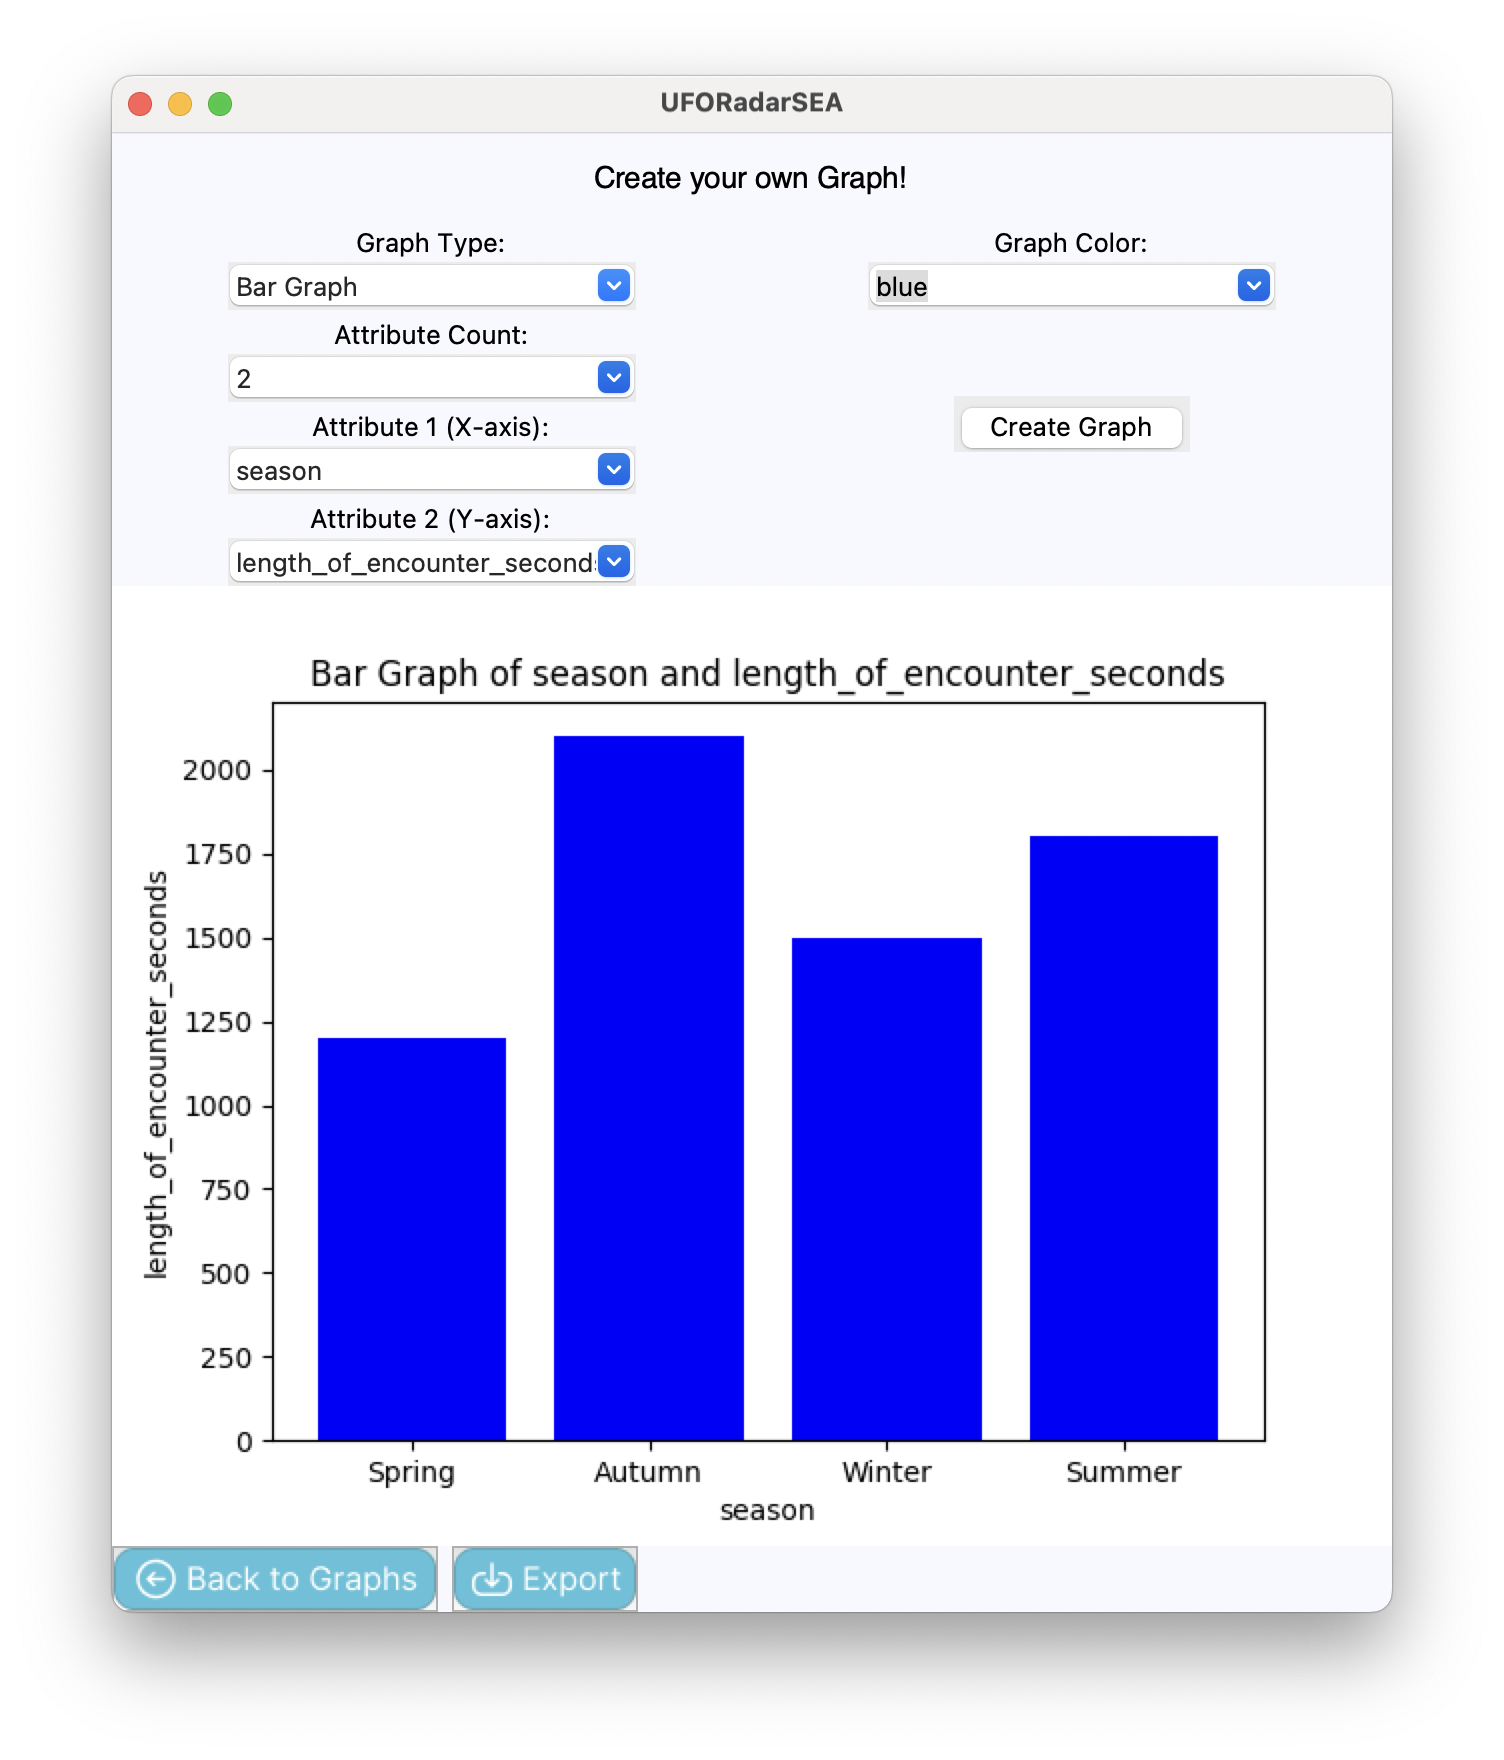
- Create custom graphs based on user-selected attributes. (Graphs Page)
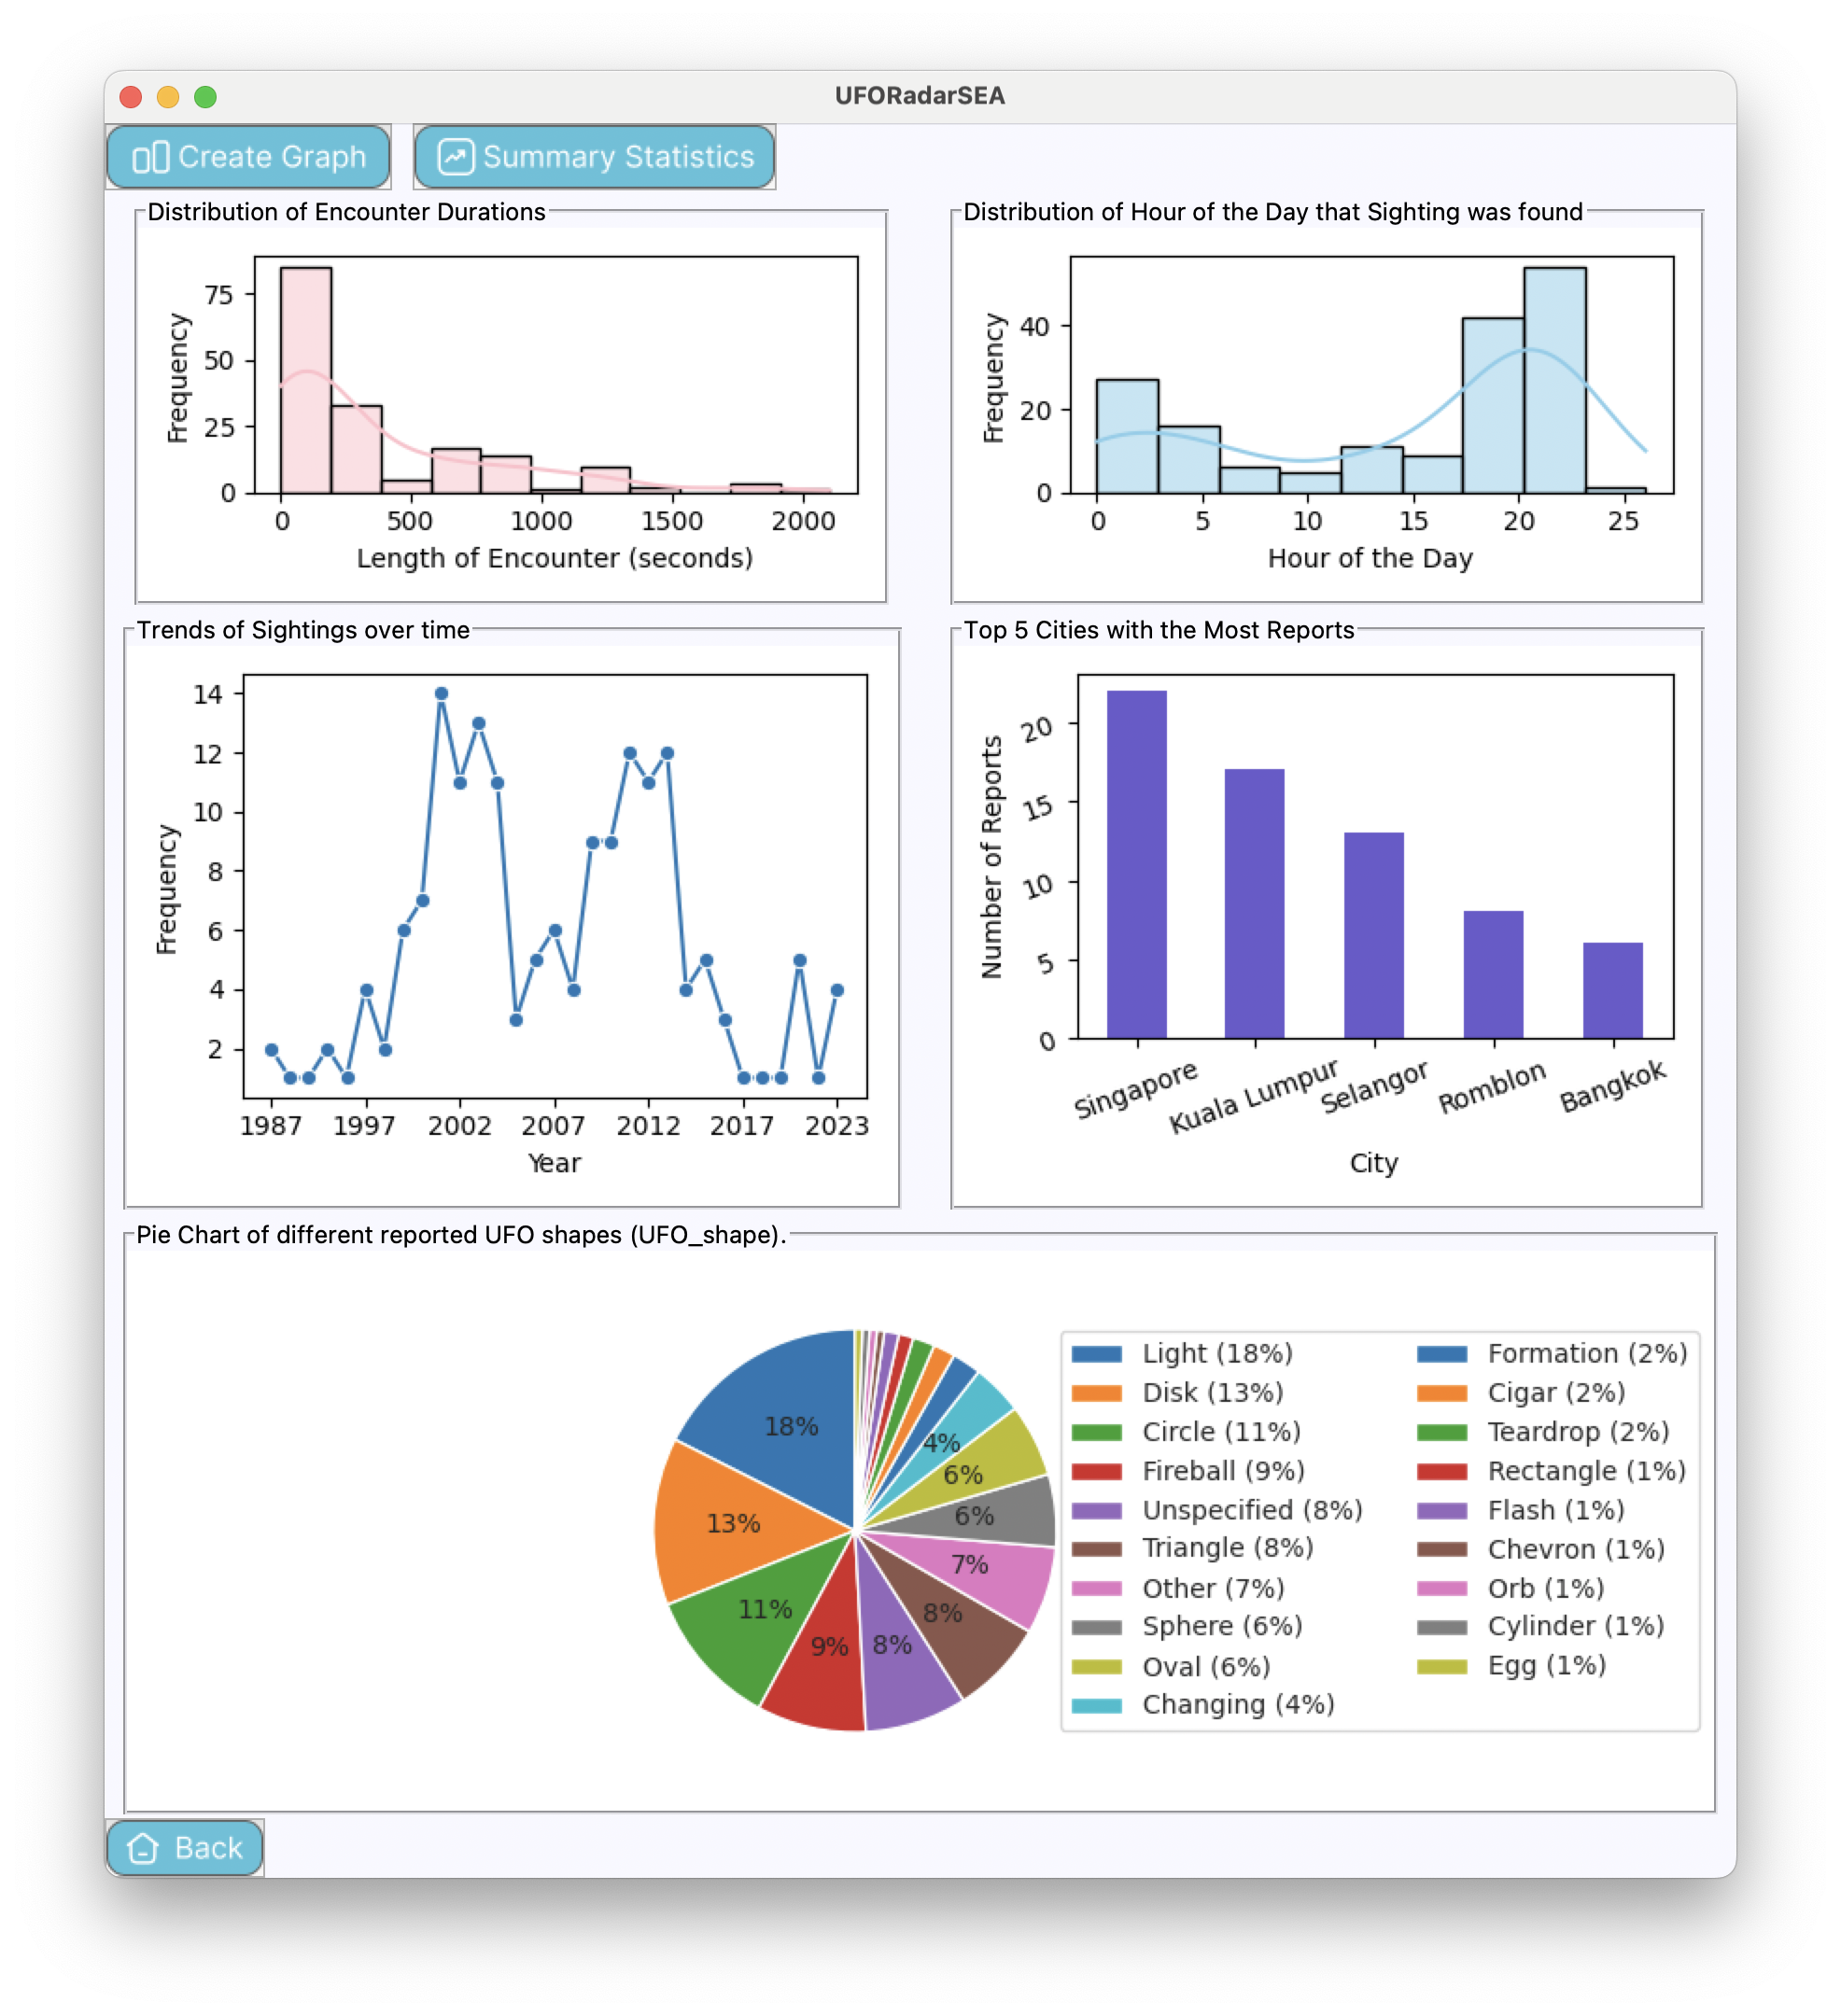
- Summary statistics of UFO sightings data, such as counts, mean, median, standard deviation, minimum, and maximum values for different attributes. (Graphs Page)
- Users can file a report of a UFO sighting. (File a Report Page)
Requirements
Requires Python 3.11 or newer.
-
pillow>=10.2.0
-
numpy>=1.26.4
-
pandas>=2.2.1
-
matplotlib>=3.8.3
-
seaborn>=0.13.2
-
tkintermapview>=1.29
Screenshots

Installation
- Clone this repository to your local machine:
git clone https://github.com/pannlnwza/UFORadarSEA.git - Navigate to the project directory
cd UFORadarSEA
How To Run
To run the application, follow these steps:
python -m venv env
Activate the virtual environment using one of the following commands, depending on your operating system:
-
Windows:
env\Scripts\activate -
macOS/Linux:
source env/bin/activate
Once the virtual environment is activated, install the required packages using pip:
pip install -r requirements.txt
Run the application:
python main.py
Project Documents
Data Sources
The UFO Radar Application uses UFO sighting data sourced from NUFORC (National UFO Reporting Center) and The Global Airport Database (GADB) data by Arash Partow.
GitHub Repository
More like this
Description:
More like this is an application for learn more about your favourite artist. By utillizing Spotify Web API via spotipy library, This application able to show information about every artist that available on Spotify along with their related artist and data analytics about their discography popularity.
USA-gun-violence Database Navigator
Description
This project is a Database Navigator for the USA Gun Violence Record. This program will use tkinter on python as the main programming language for the entire project. This project will allow the user to see the relationship of the collected data in the events, where they mostly happened, at what age the shooters usually are, etc. This program will have an interactive UI design for the user to be able to see the relationship between data. The UI will also have some graphs such as scatter graph, bar, graph, pie graph, histogram, etc. about interesting information that I found to be useful to the user interested in this topic. This program will be used to see at what age most of the criminals are. Exploring the Relationship Between Shooter Age and Incident Severity. Investigate how the age of the shooter influences the severity of gun violence in the USA.
How to Run the Program
- Clone the repository
$ git clone https://github.com/Mamajin/Year-1-Final-Project-USA-gun-violence.git - cd into directory
$ cd Year-1-Final-Project-USA-gun-violence - create a virtual env:
$ python -m venv .venv - Download Packages:
$ pip install -r requirements.txt - Run the application:
$ python USAgun_app.py
Example UI
Main Page with example1

Main Page with example2

Data Story Page

Data Reference
The Dataset used for this project is obtained from kaggle from this link Gun Violence, USA . This file contains record of some of the shooting incidents happened in the USA.
Dog Breeds
The Year Project of Programming II, Pattharamon Dumrongkittikule 6610545472
-
Dog Breeds
-
An application giving information about dog breeds. The topic is about the relationship between Intelligence, Playfulness Potential, and Tolerance of Being Alone.
How to install and run the program:
- Clone the repository
- git clone https://github.com/Pat-7-626/Dog_Breeds.git
- Change your directory to Dog Breeds
- cd Dog_Breeds
- Create a virtual environment:
- python -m venv env
- Install all requirements.txt
- pip install -r requirements.txt
- Run the program
- python main.py
References to project documents and diagrams:
The requirements
- pandas>=2.2.2
- matplotlib>=3.8.3
- scipy>=1.13.0
-
seaborn>=0.13.2
- My GitHub Repository
Trend of Currency
Ui to see similarity in currency trend to see connections between each currency
Note:
if tk combobox choices went beyond window span,
move the tk screen down so that it will display combobox choices upwards instead of downwards.
There are 2 places that will require some time to load:
- Open for the first time per session.
- Changing the main currency in first page. But other than that, other features shouldn't take longer than 5 minutes.
How to install
In your terminal, do the following:
git clone https://github.com/Karczel/Trend-of-Currency
 ```

## How to run:
### Go to Project directory: <br/>
cd
to get```;
find your cloned project and get its directory from its properties.
Create a virtual environment:
Mac:
python -m venv env
 ```

Windows: <br/>
.\env\Scripts\activate (concept)
. env/bin/activate
### Install all requirements in requirements.txt: <br/>
pip install -r requirements.txt ```
run app.py in your Python virtual environment:
python3 app.py
References to project documents:
Dataset:
ultimate_sudoku
The ultimate sudoku is a 2-page GUI, including a default page where users can interact with graphs and a data storytelling page where users can select attributes to see how the attributes have correlation with each other and what the story they have between those attributes.
Main Features
- The statistics and graph of each attributes
- can filter a data
- can adding more data to a graph and statistics
Install
- git clone https://github.com/PanidaRumriankit/ultimate_sudoku
Road incident deaths
Description
The GUI application was created using Tkinter and Python to allow users to visualise, analyse, and interact with global road incident deaths in 1990-2019 data to obtain useful knowledge or insights. The application contains 3 pages, a Storytelling page, a DataExploration page, and a Dataset page.
-
Storytelling: display descriptive statistics, graphs, and charts, with little interactivity
-
DataExploration: The user can fully alter the view and interact with graphs
-
Dataset: displays the dataset used for calculating and generating the graphs
Interaction
Storytelling
-
Users can select a year to view a histogram and descriptive statistics.
-
Users can pick a graph to display from the catalog.
DataExploration
-
Users can select (filter) a duration from 1990 to 2019.
-
Users can filter the entities they want to include in the graph.
-
Users can filter the type of death they want to include in the graph.
-
Users can switch the graph unit between “Total deaths” and “Death rate”.
-
Users can switch the mode between “Standard” and “Top rankings”.
-
Users can select the type of graph they want.
-
Users can press “GENERATE” to generate the wanted graph.
Dataset
- Users can view and scroll the dataset as they want.
Install and Run the Application
See more in the project wiki.
Source of Data
The datasets used in this project are from Our World in Data and World Health Organization
GitHub repository
Banana Quality Estimate -Using boxplot to compare frequency in good or bad quality -Basic visualize frequency of each attribute -Basic Scatter plot from 2 attribute -Estimate the quality of banana from basic input
How to run and install
First clone the git repository git clone https://github.com/Glassesdwarf/Banana_Quality_project.git then cd to folder cd Banana_Quality_project 3.Installing requirement.txt pip install -r requirements.txt 4.Run the program python banana_screen.py File banana_graph.py - are for making visualize banana_screen.py - is main application check_bar.py - is for check bar in main application Data reference https://www.kaggle.com/datasets/l3llff/banana Git repository https://github.com/Glassesdwarf/Banana_Quality_project


